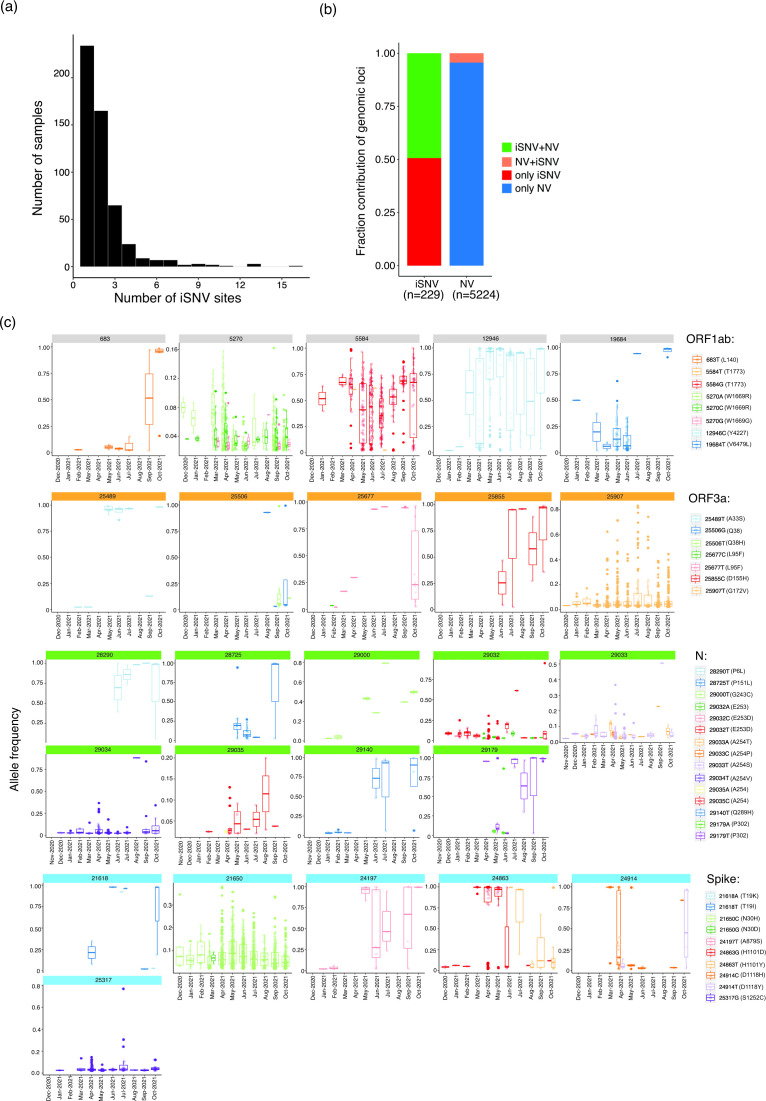
Fig. 4.
SARS-CoV-2 iSNVs identified from Telangana, India. (a) Distribution of number of iSNVs in samples. (b) Distribution of genomic loci with shared and unique iSNVs and NVs. (c) Timeline of allele frequency changes in the minor alleles in ORF1ab, ORF3a, N and S proteins. Box plots indicate allelic frequency distribution while points represent samples in which the allele was identified. Only those alternate alleles whose allele frequencies were either consistent or increased during the indicated timeline are shown.

