Figure 1.
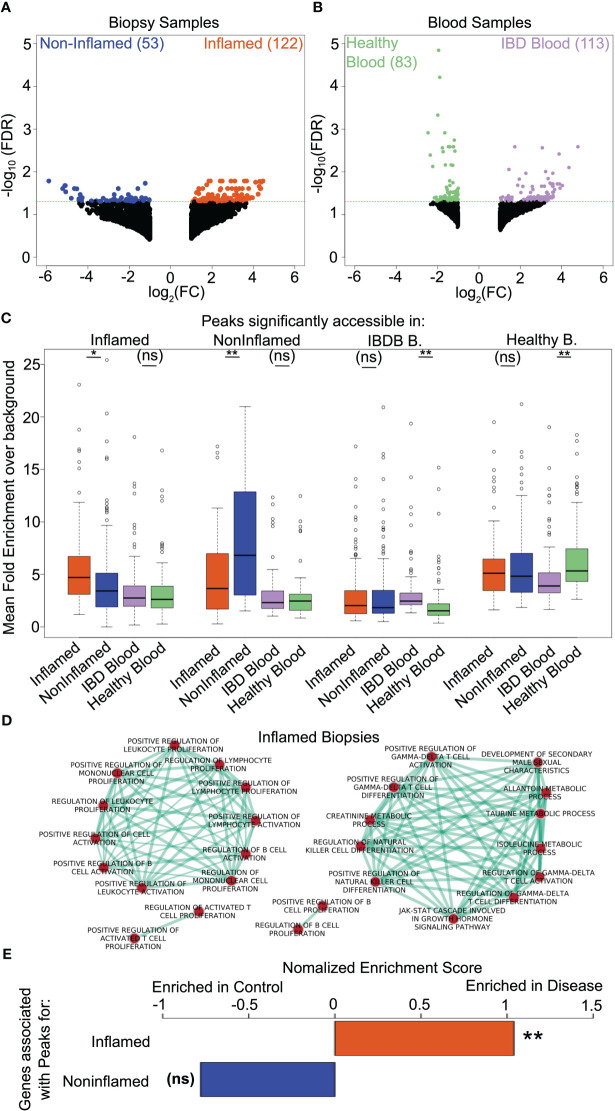
A subset of chromatin accessibility changes is localized to the site of inflammation in IBD patients. (A, B) Volcano plot showing log2 fold change (x axis) vs -log10(FDR) of chromatin accessibility (FDR corrected, negative binomial test over read counts computed using EdgeR for all sites with a minimum of log 2-fold change between conditions) for a) CD4 T cells from Inflamed (orange) vs non-inflamed (blue) biopsies and b) CD4 T cells from the peripheral blood of IBD (purple) vs healthy (green) patients. Dotted red line indicates a q value of 0.05, non-significant changes are shown as black dots. (C) Boxplots showing the mean fold enrichment over background for the significantly differentially accessible peaks in each condition within each other condition, colours as per volcano plots. Differential accessibility between all groups was assessed using the Wilcoxson sign rank test. (D) Genes regulated by differentially accessible regions in CD4 T cells from non-inflamed and inflamed biopsies were predicted as per Thurman et al. (29). Enrichment analyses of GO biological process on such predicted genes were performed using the BINGO plugin in Cytoscape. Shown are the inflammatory pathways enriched in genes regulated by regions that were more accessible in CD4 T cells from inflamed biopsies. (E) Normalized enrichment scores comparing the expression of genes that were more accessible in CD4 T cells from inflamed (top bar) or noninflamed (bottom bar) biopsies in CD4 T cells isolated from IBD patients vs. those isolated from age-matched controls. Scores were calculated using GSEA. *p<0.05; **p<0.01; ns: non-significant.

