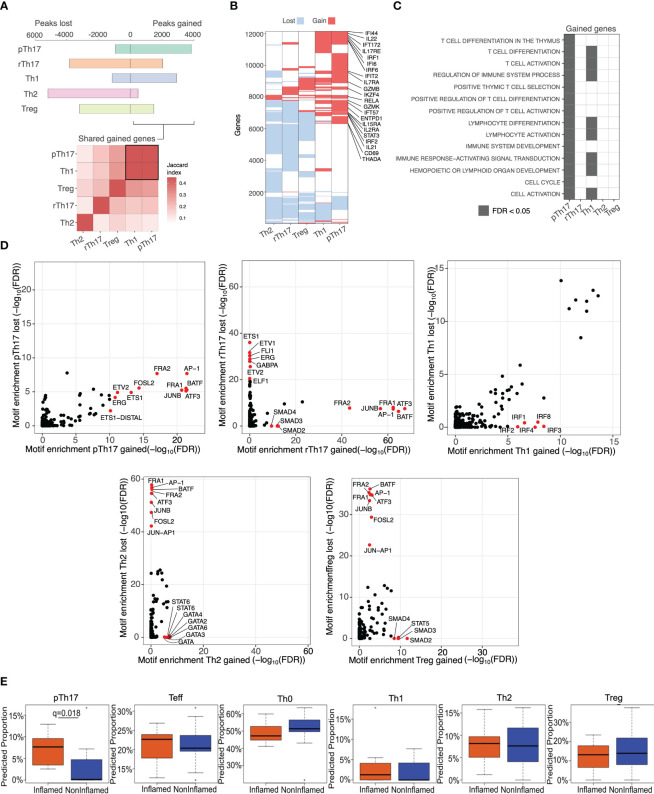
Figure 2.
Chromatin accessibility changes associated with pTh17 T-Cell polarization are associated with inflamed biopsy-specific gains of chromatin accessibility. (A) Top: Number of accessible sites gained (right) or lost (left) following polarization into different CD4 T cell subpopulations relative to naïve CD4 T cells. Sites considered as gained/lost during polarization were detected in at least 2/3 of samples of each given condition and excluded those detected in effector CD4 T cell samples. Bottom: Pairwise similarity between set of genes gained by each cell type, ordered by hierarchical clustering. (B) Genes that were gained/lost by each cell type. Genes and cell types were ordered by hierarchical clustering. Relevant genes gained by both Th1 and pTh17 cells were annotated. (C) Enrichment analysis of GO biological process on gained genes in each T cell population. Significantly enriched terms (FDR < 0.05) are shown in gray. (D) Motifs enriched within subpopulation specific peaks identified by Homer with default parameters, using as background the catalog of peaks called in at least one sample. Relevant motifs that were significantly enriched (FDR < 0.05) are shown in red. (E) Boxplots of predicted proportions of each population within each inflamed (orange) and non-inflamed (blue) biopsy based on CIBERSORT deconvolution at the subpopulation-specific peaks. Significance computed via Wilcoxson sign-rank test.

