Figure 3.
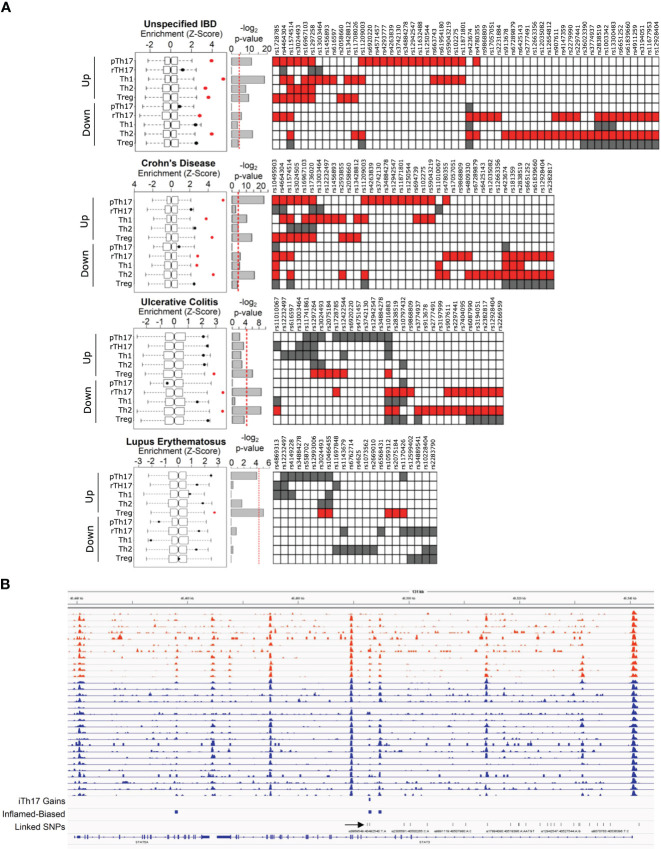
IBD risk loci are enriched within accessible chromatin regions in intestinal-resident CD4 T cells and pTh17 cell population. (A) Enrichment of all risk SNPs for IBD, Crohn’s Disease, Ulcerative Colitis and Lupus Erythematosus in the NGHRI GWAS catalogue. (right) Box and whisker plots show the enrichment score distribution of risk SNPs within the matching null set for each set of accessible chromatin loci unique to each subpopulation relative to effector CD4 T cells. The bar inside the box corresponds to the median enrichment score of the null set. Points correspond to observed enrichment. The significantly enriched genome regions (Bonferroni corrected P-value < 0.01) are marked in red. (center) bar plots show -log2 P-value for each enrichment. (right) Heatmaps show which annotated risk SNPs fall into an accessible region in any condition. White indicates the SNP is not present in this set of loci, red and black indicate presence of that SNP in that particular set of loci with red indicating that the set of risk SNPs are enriched in that condition. (B) ATAC-Seq signal profile of a Th17-related region, namely STAT3 intron, enriched in inflamed biopsies (orange) relative to non-inflamed biopsies (blue), where an IBD risk SNP (rs12942547) lies within (indicated by an arrow).

