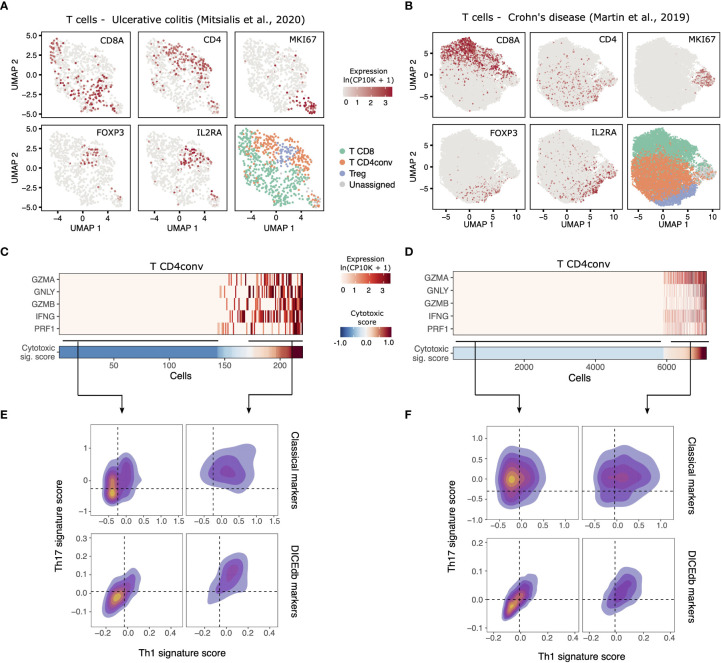
Figure 6.
Identification of cytotoxic CD4 T cells in additional scRNA-seq datasets. (A, B) Identification of CD4conv T cells in colonic mucosa sample of patients with active UC (n= 195 cells, Mitsialis et al., 2020 [32)] and inflamed ileum samples of CD patients [n= 805 cells, Martin et al., 2019 (33)]. (C, D) Expression of cytotoxicity-related genes by CD4conv T cells in each dataset. Cells are ordered according to their cytotoxic scores, as shown in the lower panel. (E, F) Density plots showing the expression of Th1 and Th17 gene signatures by cells in C0-C2. Shown are both classical signatures (Th1: TNF, STAT1, STAT4, CXCR3 and IFNG; Th17: CCR6, STAT3, RORA, IL17A, RORC) as well as those derived from the DICEdb populations.

