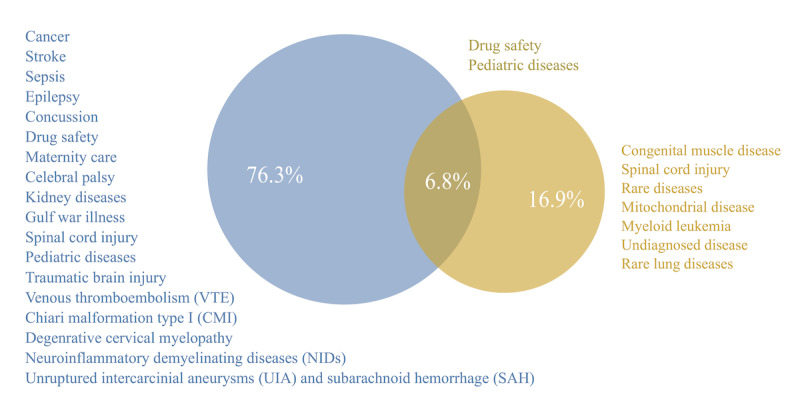
Figure 3.

Characteristics of the included studies. A Venn diagram showing the proportions of identified common data models (CDMs) for common medical conditions (76.3%; blue), rare medical conditions (16.9%; golden yellow), and medical conditions that could fit into both categories (6.8%). Additionally, an aggregated list of medical conditions that CDMs were developed for in the studies is shown in 3 different colors according to their categories.
