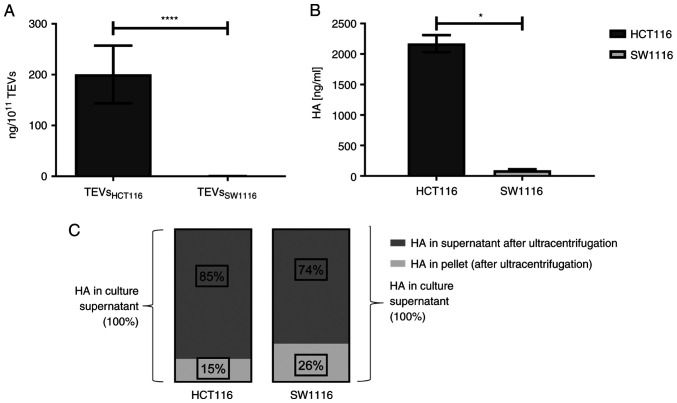
Figure 2.
HA concentration in TEVs and supernatant from cell cultures. (A) TEVsHCT116 and TEVsSW1116 (n=13; unpaired student's t test). (B) Culture supernatants from HCT116 and SW1116 cells (n=4; Mann-Whitney U test). (C) HA content in culture supernatants and pellets following ultracentrifugation, relative to concentration of HA in culture supernatants before ultracentrifugation (n=2). Data are presented as the mean ± SEM. *P<0.05, ****P<0.0001. TEVs, tumor-derived extracellular vesicles; HA, hyaluronan.

