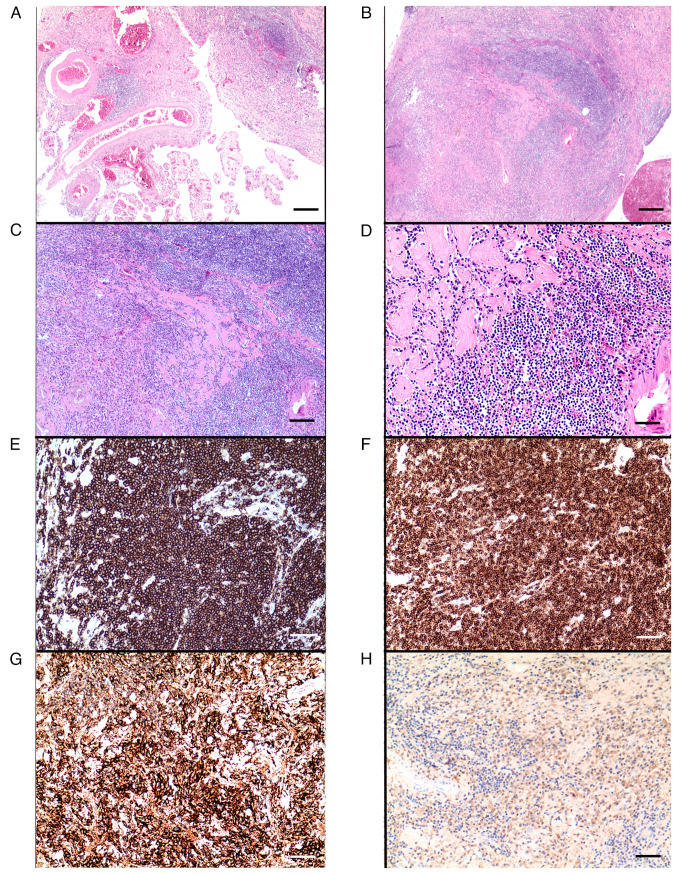
Figure 3.
(A-D) Haematoxylin and eosin staining showing (A) fragments of a choroid plexus (×20; scale bar, 420 µm) infiltrated (B) by a diffuse proliferation of lymphoplasmacellular elements with a marginal growth pattern (×20; scale bar, 420 µm), intermingled (C) with fibrosclerotic tissue (×40; scale bar, 210 µm; the same area is shown at different magnifications in B and C). (D) Small monomorphic B lymphocytes, fibrosclerotic bands and deposits of amorphous material are particularly evident at higher magnification (×100; scale bar, 84 µm). (E-H) Immunohistochemical staining showing a neoplastic B-lymphocyte population with diffuse positivity for (E) CD20 (×100; scale bar, 84 µm) and (F) Bcl2 (×100; scale bar, 84 µm). The marked plasma cell differentiation is evidenced by (G) CD138 positivity (×100; scale bar, 84 µm) with (H) k clonal restriction (×100; scale bar, 84 µm).

