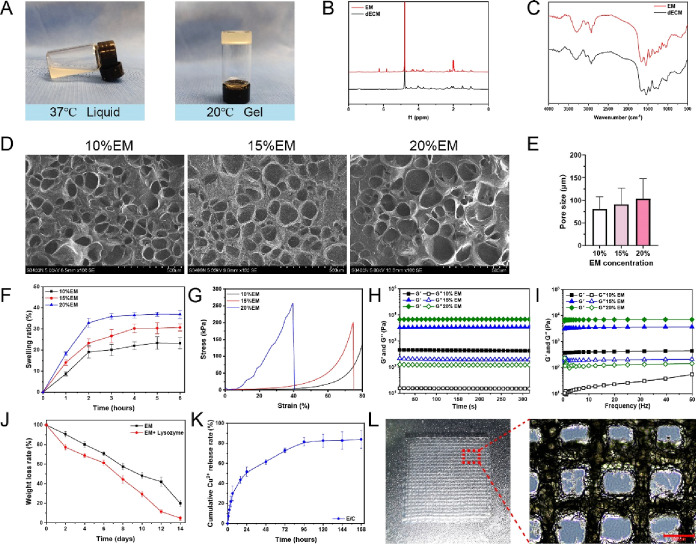
Figure 2.
(A) Photograph of the thermosensitive bioink. (B) 1H NMR spectra of dECM and ECMMA, aka EM. (C) FTIR spectra of dECM and EM. (D) SEM images of EM hydrogels. (E) Pore size of EM hydrogels. The swelling ratio (F), stress–strain curve (G), and rheological properties (H, I) of EM hydrogels. (J) Degradation curve of EM with or without lysozyme. (K) Release curve of copper ions in the E/C hydrogel. (l) Optical photograph of the EM dermis scaffold. (M) Microscopic appearance of the EM dermis scaffold.

