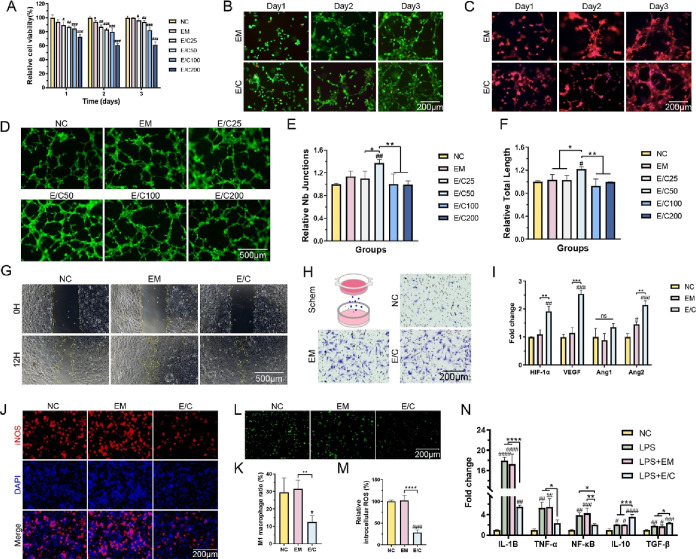
Figure 3.
(A) Cell viability tested by CCK8 assay. (B) Live/dead staining images of HMEC-1 cells cultured on hydrogels. Viable cells: green; dead cells: red. (C) Cytoskeleton staining images of HMEC-1 cells cultured on hydrogels. (D) Fluorescence (green) images of HMEC-1 cells forming tubes in vitro. Quantitative evaluation of junctions (E) and total tube length (F) in the vascularized network structure. (G) Micrograph of the wound healing experiment. Yellow curves show the scratch area. (H) In vitro invasion assay. (I) RT-PCR analysis of ANG1 and ANG2. (J) Fluorescence graphs of M1 macrophages (iNOS+) in RAW 264.7 cells treated with LPS. (K) Quantification of M1 macrophages. (L) Fluorescence (green) graphs of intracellular ROS in RAW 264.7 macrophages after H2O2 treatment. (M) Quantification of intracellular ROS in RAW 264.7. (N) RT-PCR analysis of IL10, IL1B, NK-κB, TNF-α, and TGF-β. (#P < 0.05, between the NC and others, ##P < 0.01, ###P < 0.001, ####P < 0.0001. *P < 0.05, between other groups, **P < 0.01, ***P < 0.001, ****P < 0.0001).

