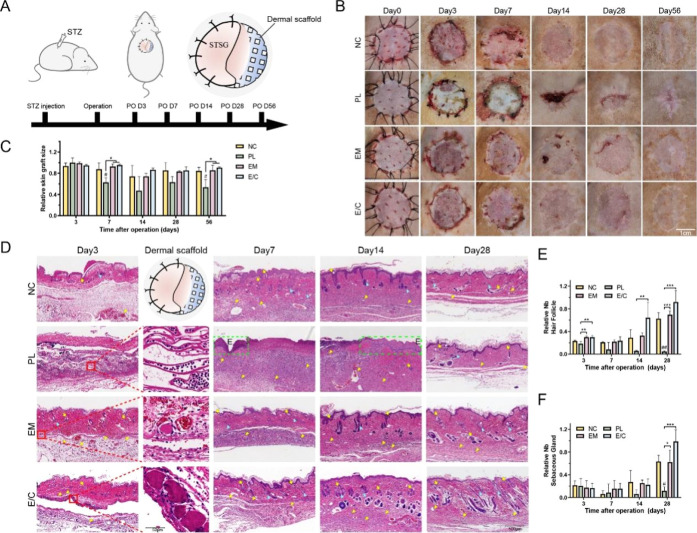
Figure 4.
(A) Schematic of the in vivo experimental design. (B) Wound healing at 0, 3, 7, 14, 28, and 56 days after operation in different groups of diabetic rats. (C) Quantitative analysis of wound size on the 3rd, 7th, 14th, 28th, and 56th days after operation. (D) H&E staining graphs of wound sections on the 3rd, 7th, 14th, and 28th days after operation. Yellow triangle: neovascularization; yellow arrow: hair follicles; blue triangle: sebaceous glands; green dotted box: epidermis. The relative number of hair follicles (E) and sebaceous glands (F) on the 3rd, 7th, 14th, and 28th days after operation. (#P < 0.05, between the NC and others, ##P < 0.01. *P < 0.05, between other groups, **P < 0.01, ***P < 0.001.)

