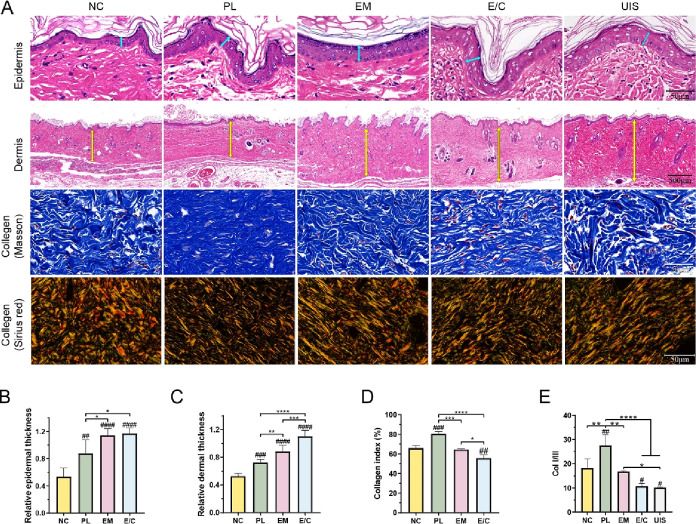
Figure 5.
(A) H&E staining, Masson staining, and Sirius red staining images of the epidermis and dermis of each group and UIS of rats on the 56th day after operation. Quantification of the epidermis thickness (B), dermis thickness (C), collagen index (D), and ratio of Col I/III (E) of each group and UIS of rats. (#P < 0.05, between the NC and others, ##P < 0.01, ###P < 0.001, ####P < 0.0001. *P < 0.05, between other groups, **P < 0.01, ***P < 0.001, ****P < 0.0001.)

