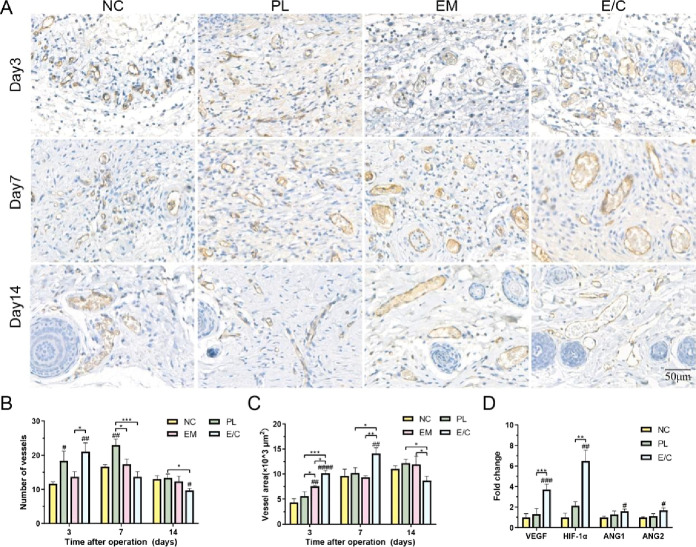
Figure 6.
(A) CD31 immunohistochemical staining images of microvessels. Quantification of the number of microvessels (B) and microvascular area (C). (D) Fold changes in ang1, ang2, and VEGF expression in the NC, PL, and E/C groups 3 days after operation. (#P < 0.05, between the NC and others, ##P < 0.01, ###P < 0.001, ####P < 0.0001. *P < 0.05, between other groups, **P < 0.01, ***P < 0.001.)

