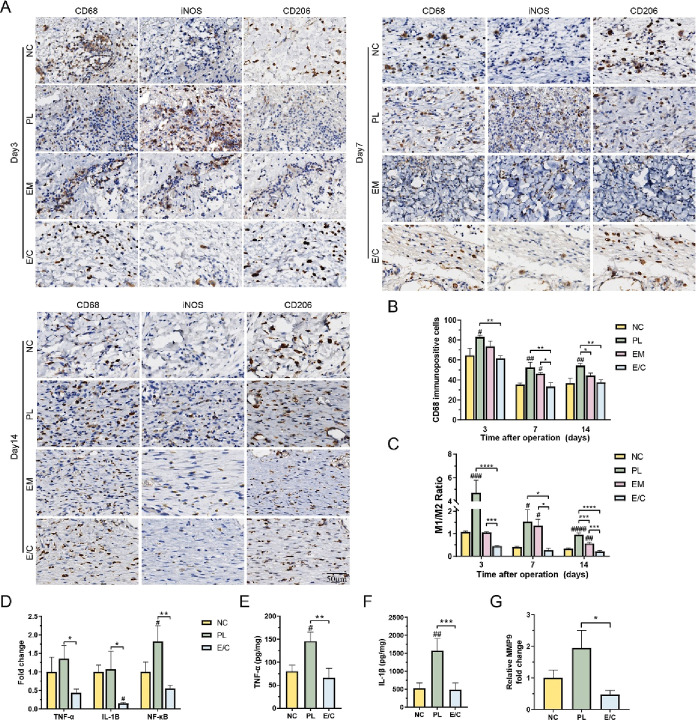
Figure 7.
(A) Immunohistochemical staining images of the panmacrophage marker CD68, M1 macrophage marker iNOS, and M2 macrophage marker CD206. (B) Quantification of M1 macrophages. (C) Proportion of M1/M2 macrophages. (D) Fold change in the mRNA level of TNF-α, IL-1B, and NF-κB. TNF-α (E) and IL-1B (F) expression measured by ELISA. (G) Fold change in the mRNA level of MMP9. (#P < 0.05, between the NC and others, ##P < 0.01. *P < 0.05, between other groups, **P < 0.01, ***P < 0.001.)

