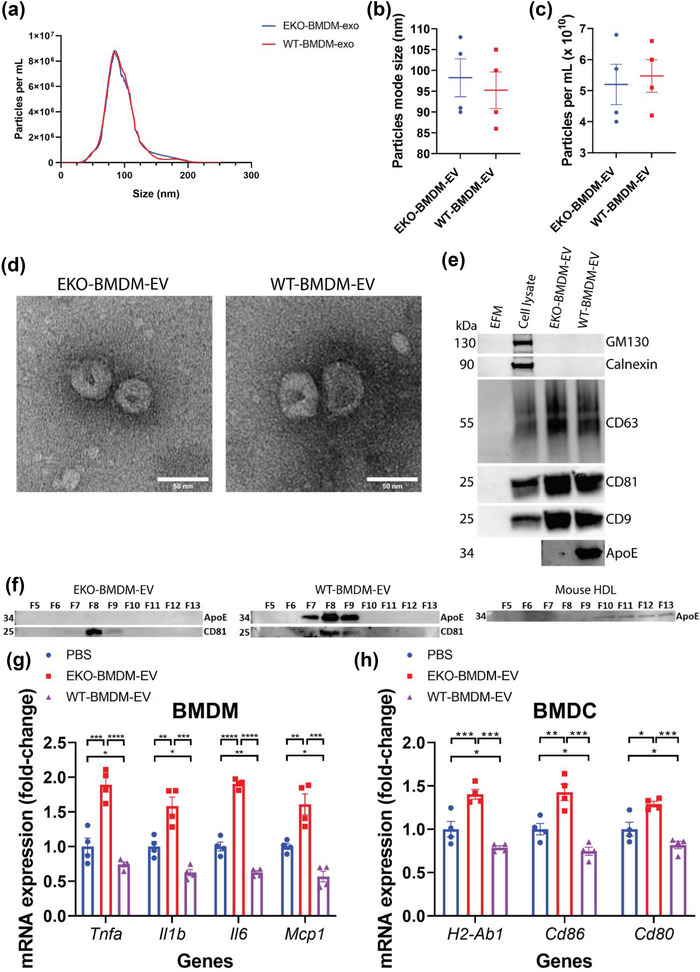
FIGURE 1.

Biophysical parameters and immune‐modulation effects of BMDM‐derived extracellular vesicles. (a) Representative concentration and size distributions of EKO‐BMDM‐EV & WT‐BMDM‐EV purified from BMDM cell culture supernatants after a 24 h period of culture as determined using nanoparticle tracking analysis. (b and c) Average mode of particle diameter (b) and concentration of purified EVs in particles/mL (c) (n = 4 samples per group). (d) Electron micrograph of purified EVs from BMDM. Scale bar: 50 nm. (e) Western blot analysis of Calnexin, GM130, CD9, CD63, CD81, and apoE in EV‐free media (EFM), cell lysate, and 1.5 × 10⁹ particles of BMDM‐derived EVs (representative of three independent experiments). (f) Western blot analysis of apoE and CD81 in EKO‐BMDM‐EV, WT‐BMDM‐EV, and mouse HDL fractionated by size‐exclusion chromatography. (g) qRT‐PCR analysis of Tnf, Il1b, Mcp1, and Il6 mRNA expression in wildtype BMDM exposed to 2 × 10⁹ particles of EKO‐BMDM‐EV, WT‐BMDM‐EV, or PBS for 18 h and stimulated with LPS (100 ng/mL) for 6 h. qRT‐PCR results were normalized to B2m or Gapdh, one representative experiment out of three independent replicates is shown; n = 4 per group. (h) qRT‐PCR analysis of H2‐Ab1, Cd86, and Cd80 mRNA expression in wildtype BMDM exposed to 2 × 10⁹ particles of EKO‐BMDM‐EV, WT‐BMDM‐EV, or PBS for 18 h and stimulated with LPS (100 ng/mL) for 6 h. qRT‐PCR results were normalized to B2m or Gapdh, one representative experiment out of three independent replicates is shown; n = 4 per group. *p < 0.05, **p < 0.01, ***p < 0.001, and ****p < 0.0001 as determined using one‐way ANOVA followed by Holm‐Sidak post‐test. Data are presented as mean ± SEM.
