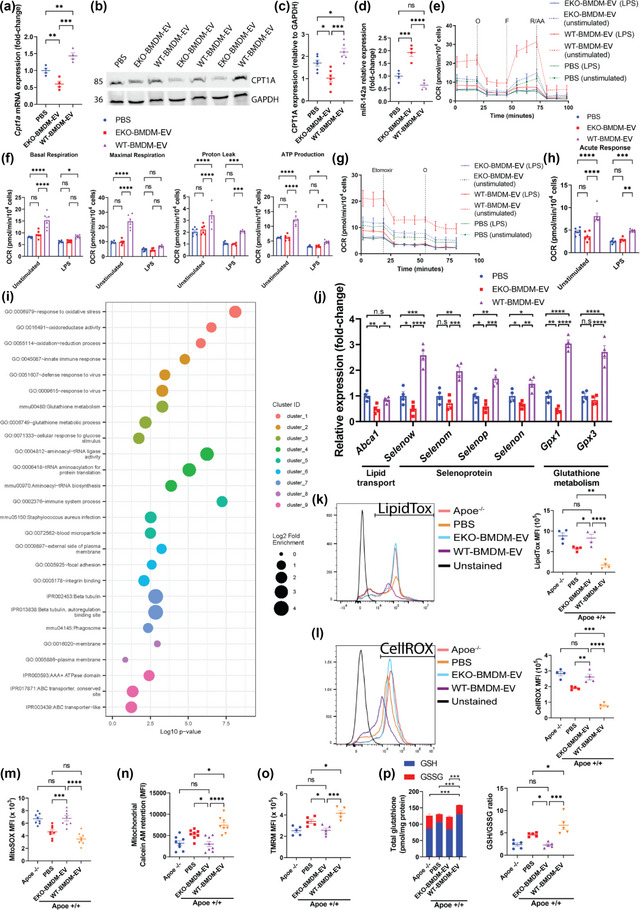
FIGURE 4.

ApoE expression dictates the capacity for macrophage EVs to improve mitochondrial health & functions while suppressing neutral lipids accumulation & oxidative stress in recipient macrophages. (a) qRT‐PCR analysis of Cpt1a mRNA expression in wildtype BMDM exposed to 2 × 10⁹ particles of EKO‐BMDM‐EV, WT‐BMDM‐EV, or PBS for 18 h. (b‐c) Western blot analysis (b) and quantification (c) of CPT1A protein levels in cell lysates of wildtype BMDM exposed to 2 × 10⁹ particles of EKO‐BMDM‐EV, WT‐BMDM‐EV, or PBS for 18 h. (d) qRT‐PCR analysis of miR‐142a‐3p expression in wildtype BMDM exposed to 2 × 10⁹ particles of EKO‐BMDM‐EV, WT‐BMDM‐EV, or PBS for 18 h. (e) Graph showing representative Seahorse Mito Stress Assay. O, oligomycin (1 μM); F, FCCP (2 μM); and R/AA, rotenone/antimycin A (0.5 μM). (f) Graph showing quantified cell‐normalized mitochondrial OCR from Mito Stress test. (g) Graph showing representative OCR measurement in response to etomoxir treatment as measured by the Agilent Seahorse instrument. Etomoxir (4 μM) and O, oligomycin (1 μM). (h) Graph showing quantified cell‐normalized mitochondrial OCR drop upon CPT1a inhibition by etomoxir. (i) GO enrichment analysis (Biological process) of the genes differentially expressed between wildtype BMDM exposed to EKO‐BMDM‐EV or WT‐BMDM‐EV. The minimum count of genes considered for the analysis was >10 and p <0.05. (j) qRT‐PCR analysis of Abca1, Selenow, Selenom, Selenop, Selenon, Gpx1 and Gpx3 mRNA expression in wildtype BMDM exposed to 2×10⁹ particles of EKO‐BMDM‐EV, WT‐BMDM‐EV, or PBS for 18 h. (k) Graph showing MFI of LipidTOX staining measured by flow cytometry in Apoe −/− BMDM or wildtype BMDM exposed to 2×10⁹ particles of EKO‐BMDM‐EV, WT‐BMDM‐EV, or PBS for 18 h measured by flow cytometry. (l) Graph showing MFI of CellROX staining measured by flow cytometry in Apoe −/− BMDM or wildtype BMDM exposed to 2 × 10⁹ particles of EKO‐BMDM‐EV, WT‐BMDM‐EV, or PBS for 18 h measured by flow cytometry. (m‐o) Graphs showing MFI of MitoSOX (m), Calcein AM (n), and TMRM (o) signals in Apoe −/− BMDM or wildtype BMDM exposed to 2 × 10⁹ particles of EKO‐BMDM‐EV, WT‐BMDM‐EV, or PBS for 18 h measured by flow cytometry. (p) Graphs showing detection of total glutathione, including reduced glutathione (GSH) and oxidized glutathione (GSSG), in Apoe −/− BMDM or wildtype BMDM exposed to 2 × 10⁹ particles of EKO‐BMDM‐EV, WT‐BMDM‐EV, or PBS for 18 h measured by flow cytometry. qRT‐PCR results were normalized to B2m or Gapdh for mRNA analysis and U6 snRNA or miR‐16‐5p for microRNA analysis. One representative experiment out of three independent replicates is shown for all experiments; n = 3–5 per group. *p < 0.05, **p < 0.01, ***p < 0.001, and ****p < 0.0001 as determined using one‐way or two‐way ANOVA followed by Holm‐Sidak post‐test. Data are presented as mean ± SEM.
