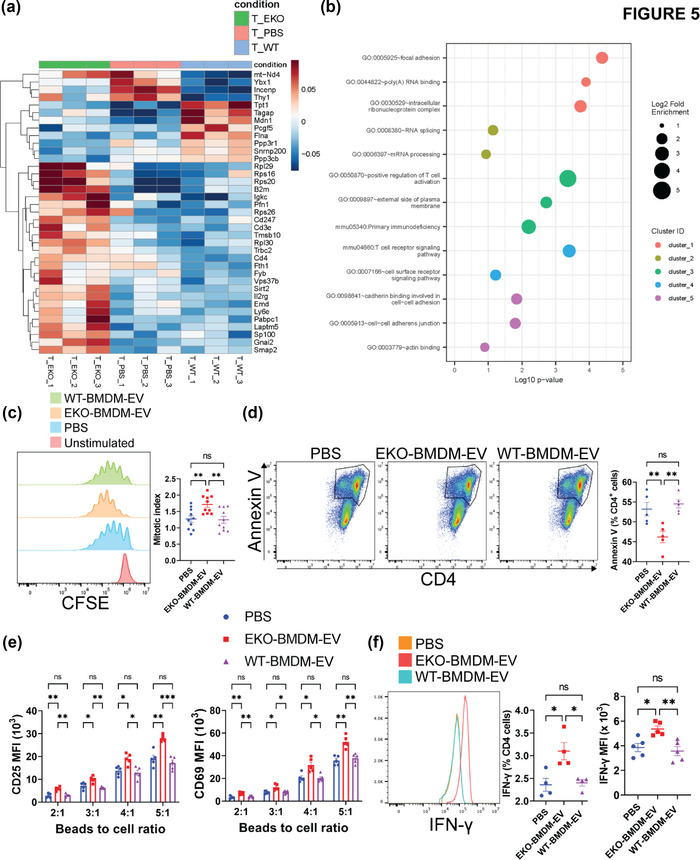
FIGURE 5.

EKO‐BMDM‐EV drive the activation and proliferation of CD4+ T lymphocytes. (a) Heatmap showing the distinct mRNA expression profiles between wildtype CD4+ T lymphocytes exposed to 2 × 10⁹ particles/mL of EKO‐BMDM‐EV, WT‐BMDM‐EV, or PBS for 24 h (n = 3 per group, p < 0.05) while stimulated with αCD3/αCD28 beads. (b) GO enrichment analysis (Biological process) of the genes differentially expressed between wildtype CD4+ T lymphocytes exposed to EKO‐BMDM‐EV or WT‐BMDM‐EV while stimulated with αCD3/αCD28 beads. The minimum count of genes considered for the analysis was >10 and p <0.05. (c) Graphs showing CD4+ T lymphocytes proliferation measured by CFSE labeling of CD4+ T lymphocytes stimulated with αCD3/αCD28 beads for 4 days. 2 × 10⁹ particles/mL of EKO‐BMDM‐EV, WT‐BMDM‐EV, or PBS were added to the culture on day 1 and 3 of the experiment. (d) Graphs showing percentage of Annexin V+ CD4+ T lymphocytes upon stimulation with αCD3/αCD28 beads for 4 days. 2 × 10⁹ particles/mL of EKO‐BMDM‐EV, WT‐BMDM‐EV, or PBS were added to the culture on day 1 and 3 of the experiment. (e) Graphs showing MFI of CD25 and CD69 in CD4+ T cells co‐cultured with αCD3/αCD28 beads, 5 ng/mL of murine IL‐2, and 2 × 10⁹ particles/mL of EKO‐BMDM‐EV, WT‐BMDM‐EV, or PBS for 48 h. (f) Graphs showing IFN‐γ+ cells and IFN‐γ MFI in CD4+ T cells co‐cultured with αCD3/αCD28 beads, 5 ng/mL of murine IL‐2, and 2 × 10⁹ particles/mL of EKO‐BMDM‐EV, WT‐BMDM‐EV, or PBS for 12 h. One representative experiment out of three independent replicates is shown for all experiments; n = 3–5 per group. *p < 0.05, ** p < 0.01, ***p < 0.001, and ****p < 0.0001 as determined using one‐way ANOVA followed by Holm‐Sidak post‐test. Data are presented as mean ± SEM.
