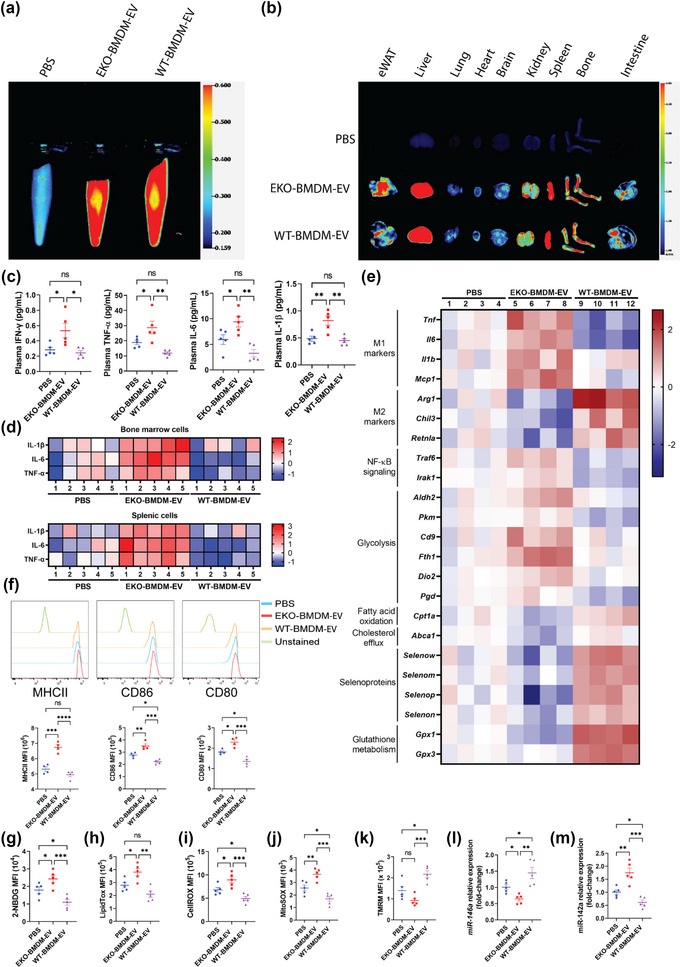
FIGURE 6.

ApoE expression dictates the capacity for macrophage EVs to improve mitochondrial health & functions while suppressing glucose uptake, oxidative stress, activation of myeloid cells & systemic inflammation in hyperlipidemic mice. (a‐b) Images of DiR fluorescence in blood (a) and organs (b) 6 h post‐injection from 8‐week‐old Western diet‐fed AAV8‐PCSK9‐injected mice infused i.p. with PBS as control or 1 × 10¹⁰ particles of EKO‐BMDM‐EV or WT‐BMDM‐EV. (c) Multiplex immunoassay analysis of TNF‐α, IFN‐γ, IL‐6, and IL‐1β from plasma of Western diet‐fed AAV8‐PCSK9‐injected mice repeatedly infused with 1×10¹⁰ particles of EKO‐BMDM‐EV, WT‐BMDM‐EV, or PBS. (d) Heat maps representing multiplex immunoassay analysis of TNF‐α, IL‐6, and IL‐1β cytokines released by LPS‐stimulated splenic and bone marrow cells (100 ng/mL for 6 h) from Western diet‐fed AAV8‐PCSK9‐injected mice repeatedly infused with 1 × 10¹⁰ particles of EKO‐BMDM‐EV, WT‐BMDM‐EV, or PBS. Data are displayed as log2 fold‐change relative to PBS group. (e) Heat map representing qRT‐PCR analysis of Tnf, Il1b, Mcp1, Il6, Arg1, Retnla, Chil3, Traf6, Irak1, Aldh2, Pkm, Cd9, Fth1, Dio2, Pgd, Cpt1a, Abca1, Selenow, Selenom, Selenop, Selenon, Gpx1 and Gpx3 mRNA expression in peritoneal macrophages of Western diet‐fed AAV8‐PCSK9‐injected mice repeatedly infused with 1 × 10¹⁰ particles of EKO‐BMDM‐EV, WT‐BMDM‐EV, or PBS. Data are displayed as log2 fold‐change relative to PBS group. (f) MFI of MHC‐II, CD86, and CD80 expression in splenic Ly6C− MHCII+ CD11c+ cells measured by flow cytometry. (g‐k) Graphs showing MFI of 2‐NBDG (g), LipidTOX (h), CellROX (i), MitoSOX (j), and TMRM (k) signals in circulating Ly6Chi monocytes of Western diet‐fed AAV8‐PCSK9‐injected mice repeatedly infused with 1 × 10¹⁰ particles of EKO‐BMDM‐EV, WT‐BMDM‐EV, or PBS. (l‐m) qRT‐PCR analysis of miR‐146a‐5p (l) and miR‐142a‐3p (m) expression in peritoneal macrophages of Western diet‐fed AAV8‐PCSK9‐injected mice repeatedly infused with 1 × 10¹⁰ particles of EKO‐BMDM‐EV, WT‐BMDM‐EV, or PBS. qRT‐PCR results were normalized to B2m or Gapdh for mRNA analysis and U6 snRNA or miR‐16‐5p for microRNA analysis. One representative experiment out of two independent replicates is shown for all experiments; n = 4–5 per group. *p < 0.05, **p < 0.01, ***p < 0.001, and ****p < 0.0001 as determined using one‐way ANOVA followed by Holm‐Sidak post‐test. Data are presented as mean ± SEM.
