FIGURE 7.

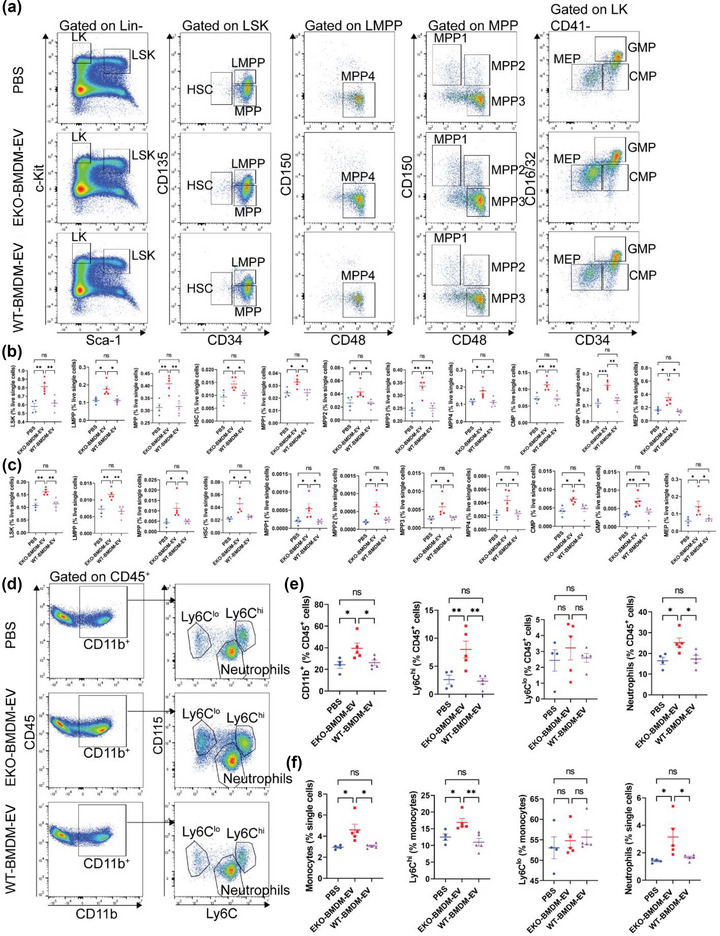
EKO‐BMDM‐EV enhance hyperlipidemia‐driven hematopoiesis and myelopoiesis. (a) Representative plots of flow cytometric analyses of hematopoietic stem and progenitor cells in the bone marrow. (b‐c) Graphs showing the percentages of hematopoietic stem and progenitor cell subsets (LSK, LMPP, MPP, MPP1‐4, HSC, CMP, GMP, and MEP) in the bone marrow (b) and spleen (c) of Western diet‐fed AAV8‐PCSK9‐injected mice repeatedly infused with 1 × 10¹⁰ particles of EKO‐BMDM‐EV, WT‐BMDM‐EV, or PBS. (d‐e) Representative flow cytometric analyses of circulating myeloid cells (d) and measurements of myeloid cell subsets (CD11b+ cells, neutrophils, Ly6Chi monocytes, and Ly6Clo monocytes) (e) in the circulation of Western diet‐fed AAV8‐PCSK9‐injected mice repeatedly infused with 1×10¹⁰ particles of EKO‐BMDM‐EV, WT‐BMDM‐EV, or PBS. (f) Flow cytometric analyses of splenic myeloid cell subsets (monocytes, neutrophils, Ly6Chi monocytes, and Ly6Clo monocytes) in the spleen of Western diet‐fed AAV8‐PCSK9‐injected mice repeatedly infused with 1 × 10¹⁰ particles of EKO‐BMDM‐EV, WT‐BMDM‐EV, or PBS. One representative experiment out of two independent replicates is shown for all experiments; n = 5 per group. *p < 0.05, **p < 0.01, ***p < 0.001, and ****p < 0.0001 as determined using one‐way ANOVA followed by Holm‐Sidak post‐test. Data are presented as mean ± SEM.
