FIGURE 8.

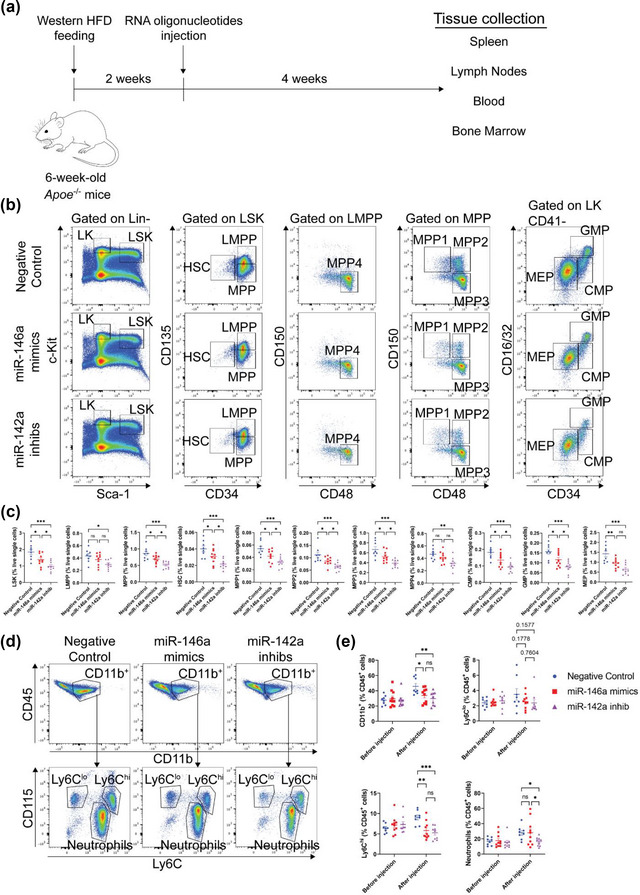
Systemic infusions of miR‐146a mimics or miR‐142a antagonists suppress hyperlipidemia‐driven hematopoiesis and monocytosis in Apoe −/− mice. (a) Schematic diagram depicting the injections of RNA oligonucleotides in Western diet‐fed Apoe −/− mice. (b) Representative plots of flow cytometric analyses of hematopoietic stem and progenitor cells in the bone marrow. (c) Graphs showing the percentages of hematopoietic stem and progenitor cell subsets (LSK, LMPP, MPP, MPP1‐4, HSC, CMP, GMP, and MEP) in the bone marrow of Western diet‐fed Apoe −/− mice repeatedly infused with 1 nmol of miR‐146a mimics, miR‐142a inhib, or negative control. (d‐e) Representative flow cytometric analyses of circulating myeloid cells (d) and measurements of myeloid cell subsets (CD11b+ cells, neutrophils, Ly6Chi monocytes, and Ly6Clo monocytes) (e) in the circulation of Western diet‐fed Apoe −/− mice repeatedly infused with 1 nmol of miR‐146a mimics, miR‐142a inhib, or negative control. Pooled data from two independent replicates is shown for all experiments; n = 8–10 per group. *p < 0.05, **p < 0.01, ***p < 0.001, and ****p < 0.0001 as determined using one‐way ANOVA followed by Holm‐Sidak post‐test. Data are presented as mean ± SEM.
