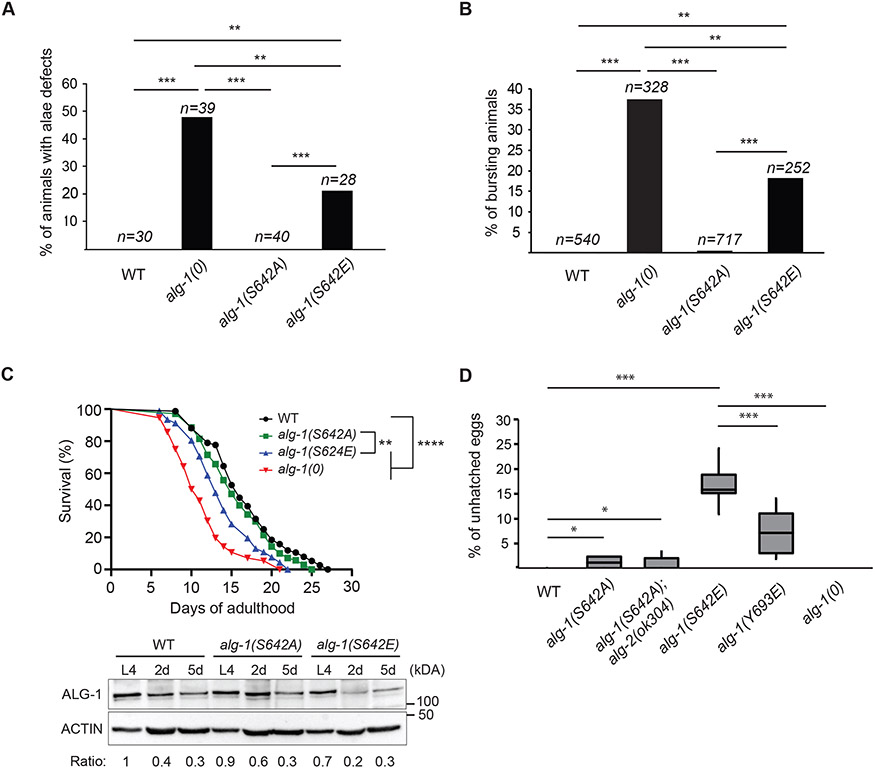
Figure 1. Phospho-mimicking ALG-1 S642E impairs C. elegans development.
(A) Edited ALG-1 of serine 642 (S642), into non-phosphorylatable alanine (A) and phospho-mimicking glutamate (E) mutant animals were monitored with Nomarski DIC microscopy to evaluate the incidence of alae formation defects at young adult stage. The graph indicates the percentage of animals affected by alae defects. P-values were measured with a two-tailed Fisher's exact test, ** indicates p<0.01 and *** p<0.001. The sample size (n=) used for quantification is indicated. (B) Lethality through vulva bursting. Percentage of alg-1(0), alg-1(S642A) and alg-1(S642E) animal populations that burst through the vulva when reaching adulthood. P-values were measured with a two-tailed Fisher's exact test, ** indicates p<0.01 and *** p<0.001. The sample size (n=) used for quantification is indicated. (C) Top: Lifespan assay. Survival curves of wild-type (WT) animals (black), alg-1(S642A) (green), alg-1(S642E) (blue) and alg-1(0) (red). P-values were calculated using the Mantel-Cox log-rank test, ****: p<0.0001 and **: p<0.01. Lifespan assays were performed with a population of n > 70 animals for each genotype. Bottom: Western blot analysis of ALG-1 at L4 larval stage, two days into adulthood (2d) and five days into adulthood (5d). Exactly 75 worms were used for each genotype and time point. Actin was used as a loading control. The ratios of ALG-1 levels relative to wild-type animals at L4 stage after normalization on Actin levels are shown. This is representative of three biological replicates. (D) Embryonic lethality. Embryos that die during development (unhatched) are counted and reported on the total progeny as a percentage. For each genotype, 8 P0 animals were allowed to lay eggs for 24h before removing them from their respective plate. After 48 hours, unhatched eggs and the total progeny (embryos and larvae) were counted. The boxplot reports the percentage of unhatched eggs relative to the total progeny for the indicated genotypes. P-values were measured by a two-tailed Fisher's exact test accounting for the total number of unhatched eggs and progeny of each P0 animal for each genotype. *: p<0.05 and ***: p<0.001.

