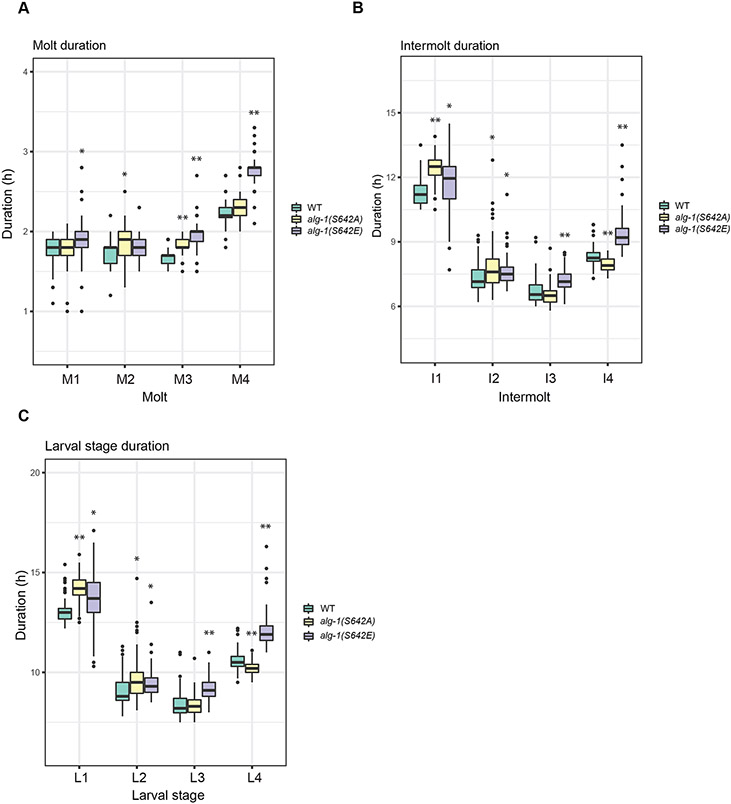
Figure 2. ALG-1 phosphorylation mutants affect larval developmental timing.
Quantification of developmental durations of single animal molts expressing the xeSi296 transgene (A), intermolts (B) and larval stages (C) in WT (n=64), alg-1(S642A) (n=68) and alg-1(S642E) (n=68) as determined by a luciferase assay. The boxplot represents median (thick black line within the box), interquartile range (box), 1.5 times the interquartile range (whiskers); data falling outside this range are plotted as outliers (circles). P-values were measured by Welch two-sample and two-sided t-test. Asterisks represent statistically significant (* p<0.05, ** p<0.01, *** p<0.001).

