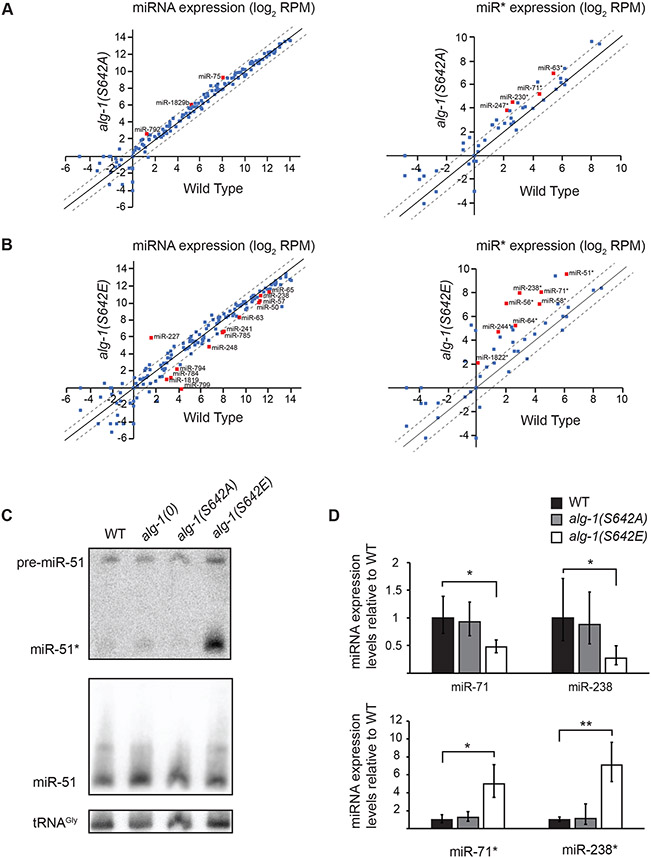
Figure 4. microRNA abundance is altered in phospho-mimicking ALG-1 S642E.
(A and B) Normalized miRNA reads expressed as log2 of reads per million (RPM) sequenced from small RNA cloning total RNA extracts of (A) alg-1(S642A) mutant animals and (B) alg-1(S642E) mutant animals compared to wild-type animals at adult stage. The scatterplot reports the guide miRNA (Left) and passenger strand miRNA (miR*) (Right) abundance in mutant vs wild-type animals. The abscissa measures the abundance in wild-type animals and the ordinate measures the abundance in alg-1(S642A) or alg-1(S642E). Each point represents the values for a specific miRNA averaged on three biological replicates. Red squares are miRNAs for which the difference in number of normalized reads compared to wild type was significant as evaluated with an unpaired Student’s t-test; p<0.05. The dashed diagonals indicate the two-fold change, and the middle diagonal (black) represents the x=y slope. (C) Detection of miR-51 by Northern Blotting in wild-type, alg-1(0), alg-1(S642A) and alg-1(S642E) adult animals. The mature guide miRNA (miR-51) or passenger strand miRNA (miR-51*) are indicated as well as the precursor molecule (pre-miR-51). The detection of tRNA glycine (tRNAgly) was used as a loading control. Representative images of two biological replicates. (D) Guide and passenger miRNA strands quantification by RT-qPCR. The levels of the guide and passenger strands of miR-71 and miR-238 in alg-1(S642A) and alg-1(S642E) gravid adult animals were measured by RT-qPCR and normalized to the levels of wild-type animals. Small nucleolar RNA sn2841 was used as an internal control gene. The error bars represent the 95% confidence interval from three biological replicates and the P-values were calculated using a two-tailed Student’s t-test; * p<0.05, ** p<0.01.

