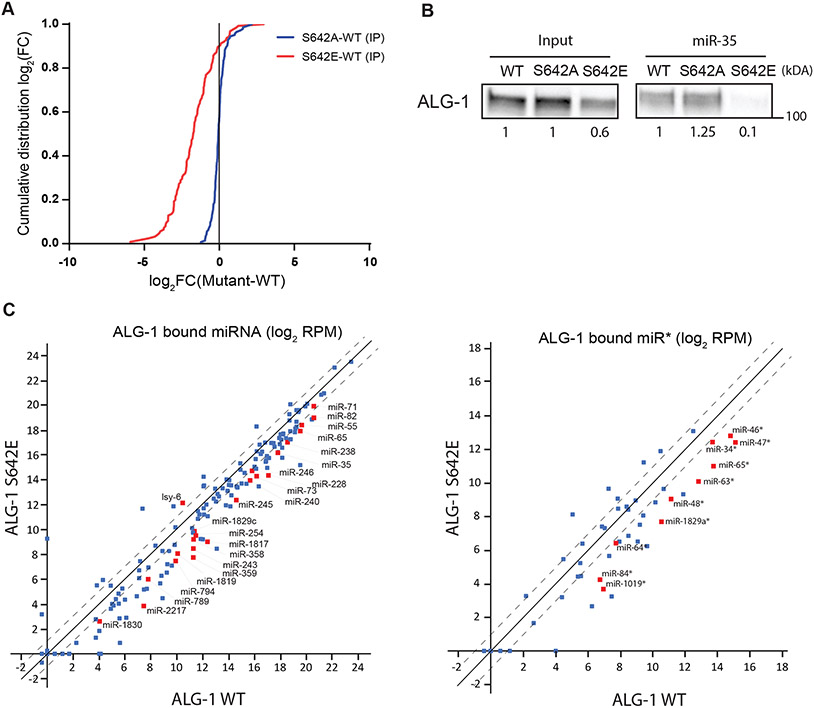
Figure 5. Phospho-mimicking ALG-1 S642E impairs binding to miRNAs.
(A) ALG-1 immunoprecipitation (IP) and small RNA sequencing experiments using wild-type (WT) and phosphorylation mutants animal populations. The plot shows the cumulative distribution of the log2-fold changes (log2(FC)) for miRNA reads in ALG-1 mutants IP vs ALG-1 WT IP averaged over three biological replicates. ALG-1 S642A mutant bind miRNAs similarly to ALG-1 WT (Blue). The ALG-1 S642E mutant binds far less miRNAs compared to WT (Red). The vertical line at 0 represents a log2FC of zero compared to WT. (B) miR-35 miRISC pulldown of ALG-1. Proteins bound to miR-35 miRNA in gravid adult extracts were pulled-down using a 2′-O-methylated and 5′ biotinylated RNA fully complementary oligonucleotide. The levels of ALG-1 pulled down in wild-type (WT) animal extracts or in phosphorylation mutants S642A and S642E were evaluated by western blotting. The ALG-1 levels in the input and in the pulldown relative to the signal in WT are shown. Representative image of three biological replicates. (C) Scatterplot of miRNA bound to ALG-1 averaged on three biological replicates and expressed as Log2 of reads per million (RPM). The guide strands (Left) and passenger strands (miR*) (Right) associated to ALG-1 are plotted comparing ALG-1 S642E and ALG-1 WT. The dashed lines indicate the two-fold change, and the middle diagonal represents the x=y slope. Red squares indicate miRNAs for which the number of reads were significantly different between WT and S642E IP, as determined with an unpaired Student’s t-test (p<0.05). miRNA reads obtained from ALG-1 IP were normalized on the number of miR-48-5p reads in each replicate as miR-48 binding to ALG-1 WT, ALG-1 S642A and ALG-1 S642E is robustly identical (Figure S5A).

