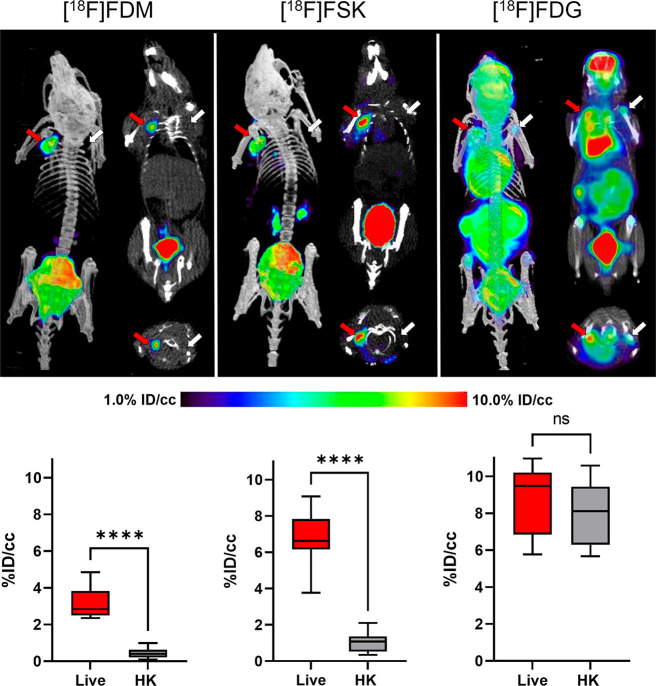
Figure 5.
μPET-CT imaging of MRSA myositis in mice with [18F]FDM, [18F]FSK, and [18F]FDG. The red arrows indicate the site of inoculation with live bacteria, while the white arrows correspond to heat-killed bacteria. The corresponding bar graphs indicate region-of-interest (ROI) analysis. As reflected by the images, the mean [18F]FDM and [18F]FSK accumulation for tissues infected with live bacteria was respectively 6.1- and 6.5-fold higher than that seen for heat-killed inoculation (P < 0.0001). In contrast, this difference was not seen for [18F]FDG.

