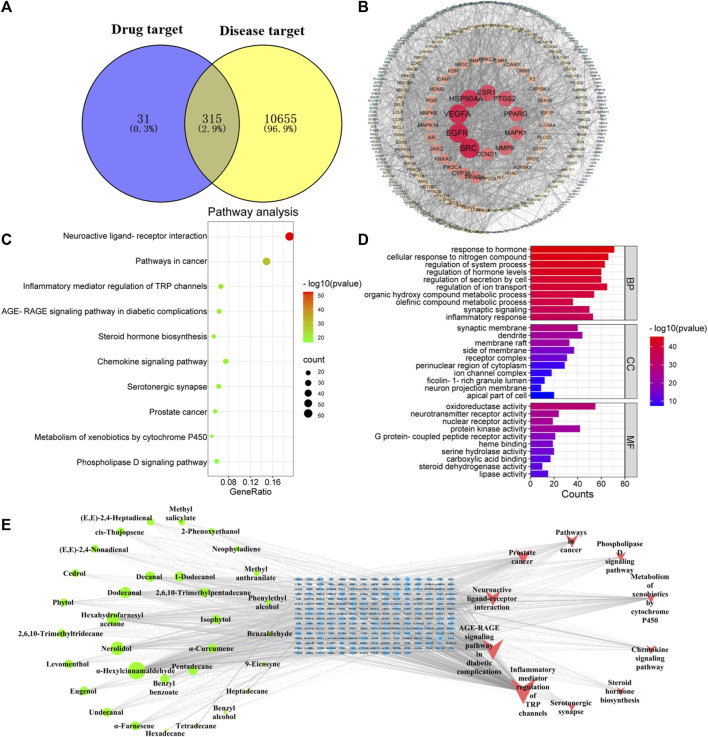
FIGURE 2.
Network pharmacology predicted the possible compound–target–pathway interaction in JGEO-mediating inflammation. (A) Venn analysis on putative targets of JGEO as well as inflammation-related genes. (B) PPI of 346 targets of JGEO associated with inflammation. (C) Bubble chart of KEGG pathway analysis. Top 10 pathways with corresponding p-values are displayed in a dot plot. The sizes of the dots represent the gene count of each term, and the color scales indicate the p-values. (D) GO enrichment analysis. The length and color of the bands characterize the number of targets involved in the related biological processes. (E) Construction of the key compound–target–pathway. The network depicts the relationships among compounds, targets, and pathways. The green circle represents the active compounds, the blue square in the middle is for the core targets, and the red triangle is for the pathway.

