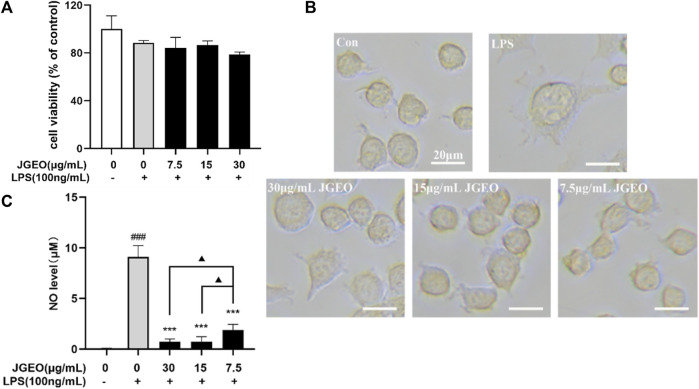
FIGURE 4.
Effects of JGEO on BV-2 cell viability, morphology, and NO level. BV-2 cells were exposed to JGEO at 7.5, 15, and 30 μg/mL for 4 h and treated with 100 ng/mL of LPS for 24 h, respectively. (A) The cell viability was evaluated by CCK8 assay. All treated groups had no significant difference compared to the control group (p > 0.05). (B) The cell morphologies were observed under a light microscope. BV-2 cells in the control group were quiescent with small soma and few pseudopodia, while those in the LPS-treated model group displayed enlarged soma and short dendritic arbors like amoeba, while JGEO reversed the morphological changes induced by LPS. (C) NO levels were determined by Griess reaction. All JGEO-pretreated groups significantly decreased the NO level. Data were analyzed by statistical analysis following the procedure mentioned in“Section 2.8” (### p < 0.001 vs. the control group, ***p < 0.001 vs. the LPS model group, and ▲ p < 0.05 in the interaction of the two groups).

