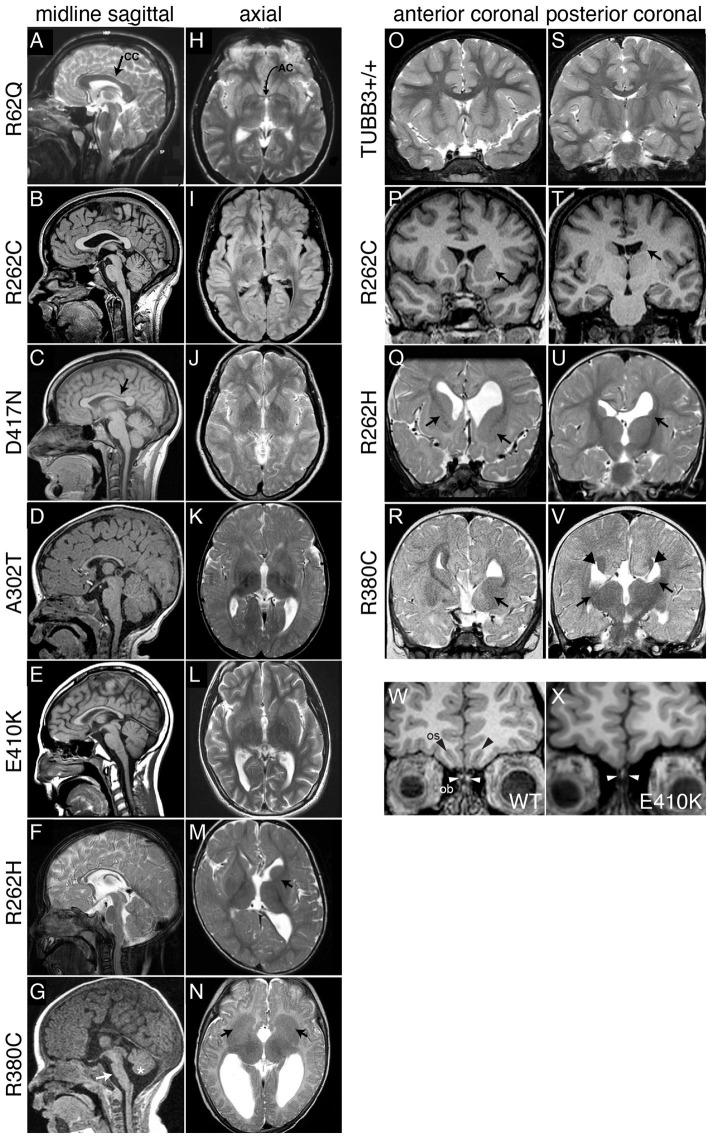
Figure 2.
Spectrum of TUBB3-CFEOM brain malformations correlates with specific TUBB3 variants. (A–G) Midline sagittal MRI showing the spectrum of corpus callosum (CC) dysgenesis; corresponding amino acid substitutions are noted to the left. R62Q (A) and most R262C (B) subjects have normal corpus callosum development, whereas D417N subjects have hypoplasia of the posterior body (C, arrow). Subjects with A302T, E410K, and R262H have diffuse corpus callosum hypoplasia (D–F). (G) R380C subjects can have corpus callosal agenesis and brainstem (arrow) and mild vermian hypoplasia (asterisk). (H–N) Axial MRI from the same subjects’ scans showing the spectrum of anterior commissure (AC) dysgenesis and overall loss of white matter compared to the normal R62Q scan (H, arrow indicates AC). (I–L) Subjects have hypoplastic AC. R262H (M) and R380C (N) subjects have anterior commissure agenesis and dysmorphic basal ganglia. The anterior limb of the left internal capsule is hypoplastic in R262H (M, arrow), whereas there is lack of clear separation between the caudate and putamen and bilateral hypoplasia of the anterior limbs of the internal capsule with R380C (N, arrows). (O–V) Anterior (O–R) and posterior (S–V) coronal sections showing the spectrum of basal ganglia dysmorphisms. Compared to a TUBB3+/+ scan (O,S), the R262C scan reveals asymmetric basal ganglia with enlargement of the left caudate head and putamen (P, arrow) and hypoplasia of the left caudate body (T, arrows). The R262H scan reveals dysgenesis of the left and right anterior limbs of the internal capsule (Q, arrows), apparent fusion of an enlarged left caudate head with the putamen (Q), hypoplasia of the left caudate body and tail (U), and asymmetrical dilatation of the lateral ventricles. The R380C scan reveals hypoplasia of the anterior limb of the internal capsule (R, arrow), fusion of the left caudate head and underlying putamen with bilateral hypoplasia of the caudate body and tail (V, arrows), and Probst bundles of callosal axons that line the bodies of the lateral ventricles (V, arrowheads). (W,X) Coronal images of olfactory sucli (OS, black arrows) and bulbs (OB, white arrows) in a control (W) compared to a subject with the E410K substitution (X). The E410K subject has olfactory sulcus agenesis and bulb dysgenesis (X, white arrows). (A–V) Reproduced with permission from Tischfield et al. (2010). (W,X) Reproduced with permission from Chew et al. (2013).

