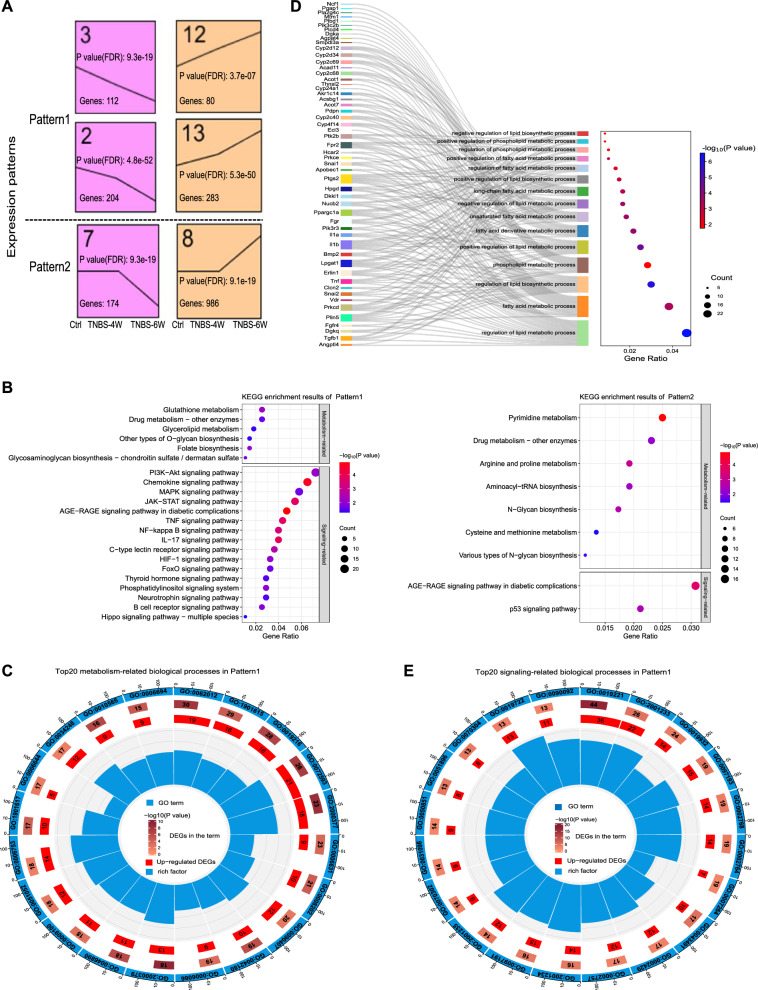
Fig. 2.
Time-course RNA-seq analysis of colonic tissues from the fibrosis mouse model. A Significant gene expression patterns identified by the STEM software; all expression patterns follow the timeline of Control (Ctrl), Inflammation (TNBS-4W), and Fibrosis (TNBS-6W). B KEGG enrichment results (mainly including signaling and metabolism-related pathways) of Pattern1 and Pattern2 (P < 0.05), in which Gene Ratio indicates the proportion of DEGs enriched in each pathway to the total number of DEGs, the size of the circle represents the number of genes enriched in the pathway, and the color of the circle represents the significance of enrichment. C The top20 metabolism-related biological processes in Pattern1 (P < 0.05, ranked by the number of DEGs in each enriched term). D GO enrichment results for terms related to lipid metabolic processes, wherein the size of the circles represents the number of DEGs in each enriched term and color of the circles represents the significance of enrichment (P < 0.05). E The top20 signaling-related biological processes in Pattern1 (P < 0.05, ranked by the number of DEGs in each enriched term). GO enrichment results are presented as circle diagrams: the first circle (from outside to inside) represents the GO term, and outer circle represents the coordinate scale of the number of genes; second circle represents the number of DEGs annotated to the GO entry, and color represents the -log10 (P value) of the enrichment analysis; third circle represents the number of differentially up-regulated DEGs in the term; and fourth circle represents the percentage of enrichment factors. n = 5 per group. STEM Short Time-series Expression Miner, KEGG Kyoto Encyclopedia of Genes and Genomes; GO Gene Ontology, DEGs differentially expressed genes

