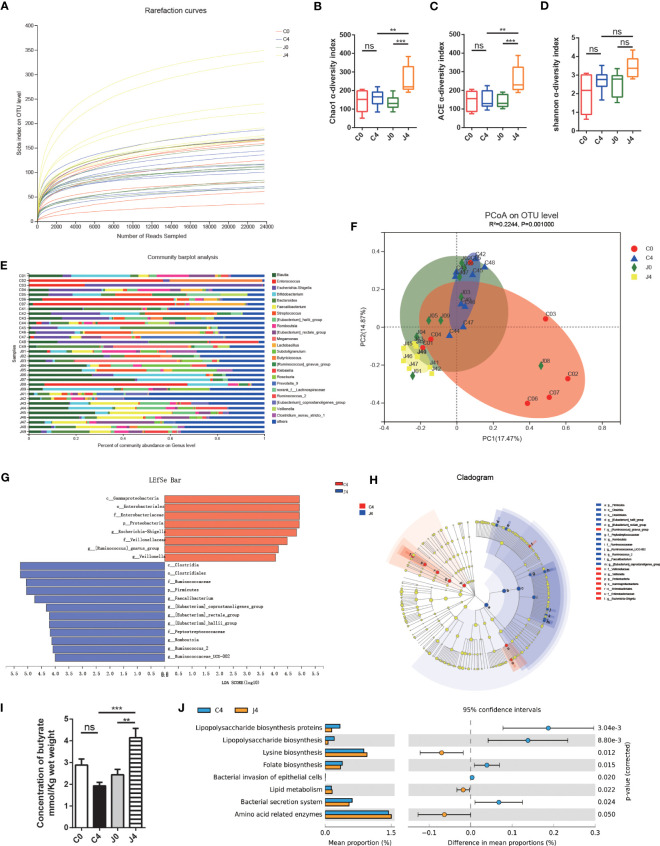
Figure 1.
JK5G postbiotics remodeled gut microbial communities and butyrate concentration. (A) Rarefaction curves of sequencing samples at baseline and after four treatment cycles grouped by intervention status. The α diversity of intestinal microbial compositions evaluated by Chao1 (B), ACE (C), and Shannon (D) indexes at baseline and after four treatment cycles. Data are represented as medians with interquartile ranges. (E) Changes in the taxonomic composition of gut microbiota at baseline and after four treatment cycles. Stacked bar charts show the individual variability of the relative abundances of major bacterial genera. (F) Principal coordinate analysis (PCoA) based on an Bray-curtis distance matrix at the OTU level. (G) Linear Discriminant Analysis (LDA) scores derived from LEfSe showing the biomarker taxa (LDA score > 2 and p < 0.05 determined by the Wilcoxon signed-rank test). (H) Cladogram plots of gut microbiota in the C4 vs. J4 groups. (I) Butyrate concentration in fecal samples. (J) Function prediction of microbial genes involved in metabolism by PICRUSt analysis and Welch’s t-test (p < 0.05). For panel F, colorful circles represent 95% confidence intervals calculated by Welch’s inverted method. Data are presented as means ± SEM. **p < 0.01, ***p < 0.001, ns, no significance, compared to the marked groups. Multiple groups were tested by one-way ANOVA followed by Bonferroni analysis.

