Figure 1.

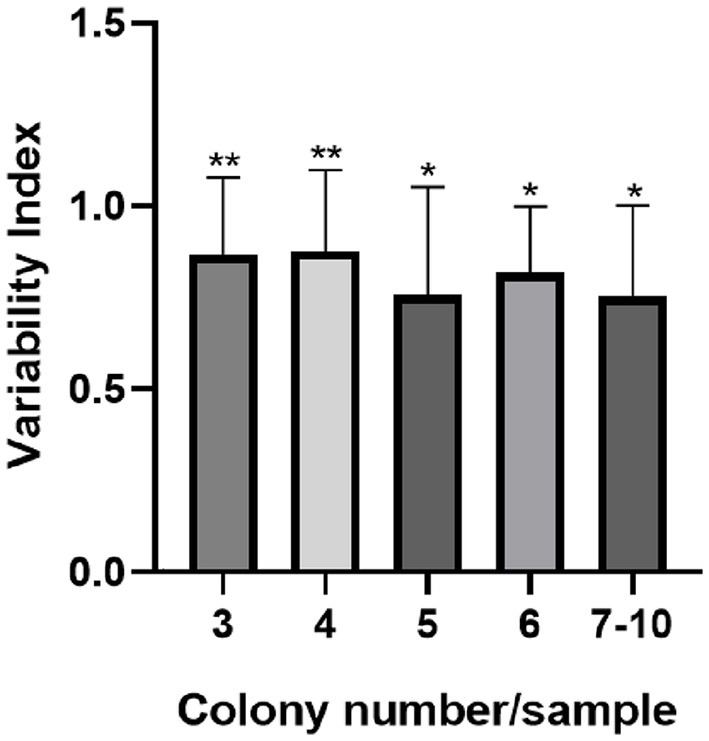
Variability index of C. jejuni per sample according to the number of isolated colonies. The error bar indicates the standard deviation, *p < 0.05; **p < 0.01 by the Kruskal–Wallis test.

Variability index of C. jejuni per sample according to the number of isolated colonies. The error bar indicates the standard deviation, *p < 0.05; **p < 0.01 by the Kruskal–Wallis test.