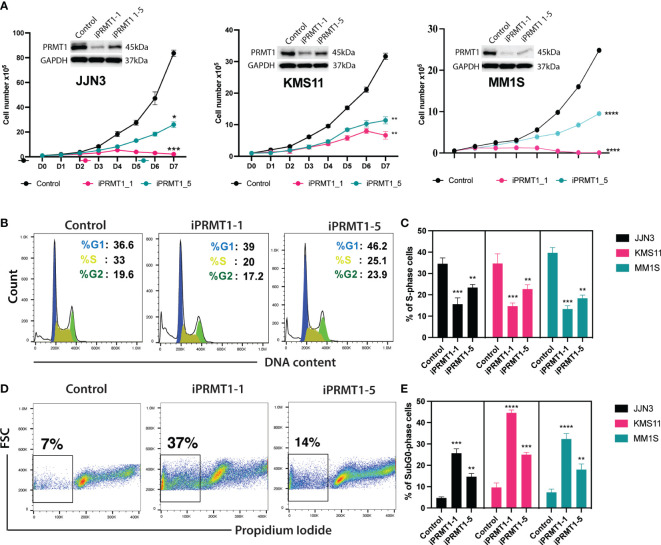
Figure 2.
Knockout of PRMT1s impairs MM cell growth, arrests cell cycle, and induces cell death. (A) Growth curves of 3 different MM cell lines (JJN3, KMS11, and MM1S) upon knockout of PRMT1 by two different sgRNAs (iPRMT1_1, and iPRMT1_5). Western blot data (on top of each growth curve) shows the knockout efficiency of PRMT1 in MM cells for each sgRNAs. (B) Representative FACS blot shows cell cycle profile of MM cell lines upon knockout of PRMT1 by two different sgRNAs. (C) Bar graph depicts mean values of percentage of S phase cells from three independent biological replicates. (D) FACS blot describes the representative cell death (Sub G0 phase) profile of MM cell lines. (E) Bar graph shows the mean values of percentage of Sub-G0 phase cells from biological triplicates. P values were calculated using one-way Anova (C, D) or two-way Anova (A) tests are shown as ****P<0.0001, ***P<0.001, **P<0.01 and *P<0.05. Data represent as means of three independent replicates.

