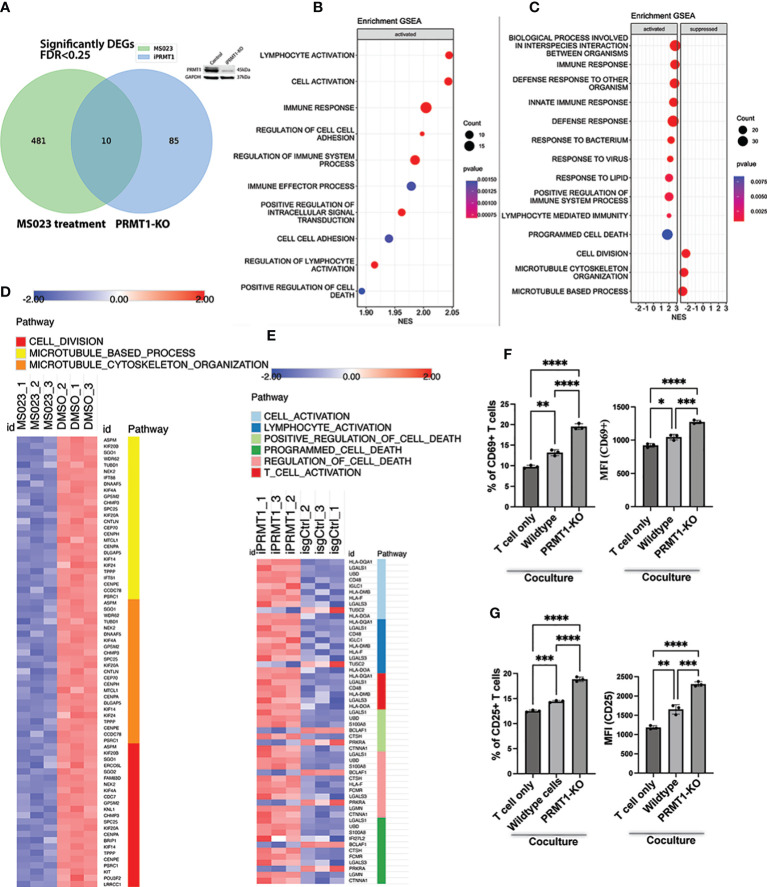
Figure 5.
Transcriptional impacts of PRMT1 suppression in MM cell lines. (A) Venn diagram shows the numbers of differentially expressed genes (DEGs) in MM cells upon PRMT1-KO (using iPRMT1_1) or treated with MS023. Western blot on the top of the Venn diagram proves the knockout efficiency of PRMT1. (B) Gene set enrichment analysis (GSEA) of DEGs in PRMT1-KO cells. (C) GSEA of DEGs in MM cells treated with MS023. Heat map presents the expression of DEGs in MS023-treated MM cells (D) and PRMT1-KO cells (E). (F) Graph depicts the percentage of CD69+ T cells (left) and the mean fluorescence intensity (MFI) of CD69 (right) either cultured alone or cocultured with MM cells (wildtype and PRMT1-KO cells). (G) Bar graph describes the percentage of CD25+ T cells (left) and the MFI of CD25 (right) either cultured alone or cocultured with irradiated MM cells (wildtype and PRMT1-KO cells) for 2 days. Data are shown as mean values. P values calculated using one-way Anova test and are shown in the graph or as ****P<0.0001, ***P<0.001, **P<0.01 and *P<0.05.

