Figure 6.
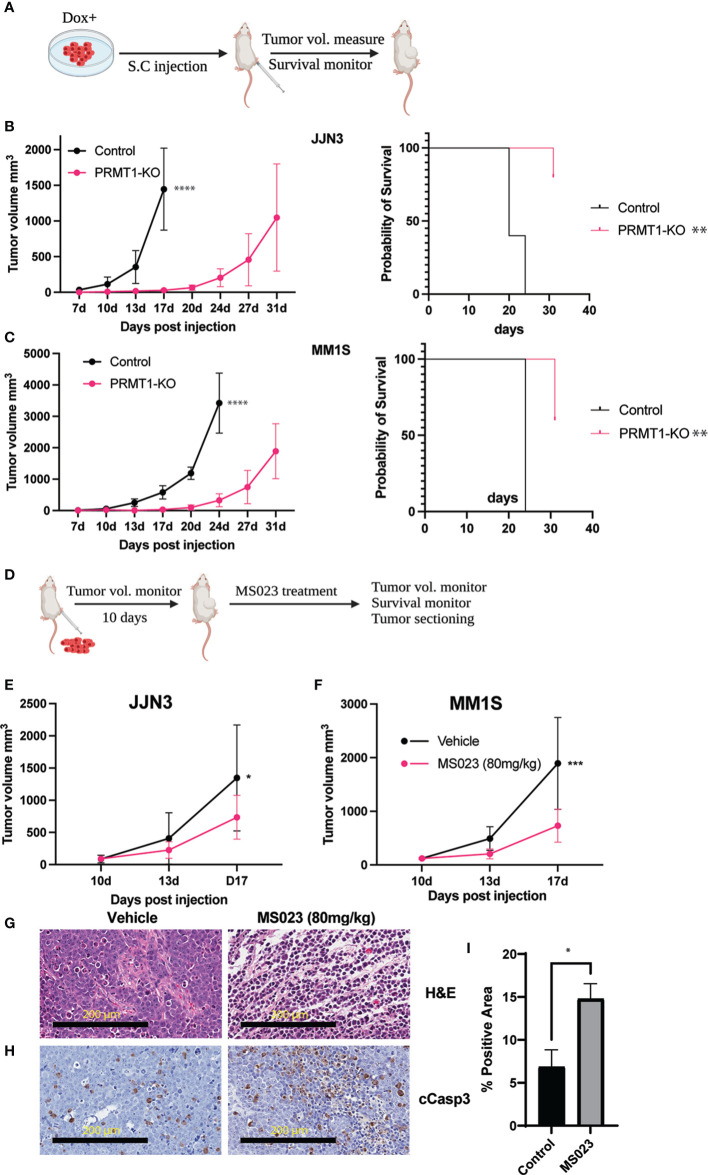
Suppression of PRMT1 attenuates MM tumor growth in vivo. (A) Experimental scheme of MM xenograft model for PRMT1-KO cells. Tumor volumes of in the mice injected with JJN3 (B) or MM1S (C) WT cells (control) and PRMT1-KO cells (left, n=5), Kaplan-Meier survival curve of mice injected with WT and PRMT1-KO cells. (D) Experimental scheme of MM xenograft model for MS023 treatment. Tumor volumes at different time points of vehicle group (N=5) and MS023-80mg/kg group (n=5) in mice injected with JJN3 cells (E) and MM1S (F) cells. (G) Hematoxylin and Eosin (H&E) staining of tumor sections. (H) immunohistochemistry staining for the cleavage of Caspase 3 (cCasp3). (I) Bar graph summarizes the cCasp3 positive area in the stained slides. Data are shown as mean values. P values calculated using two-way Anova test and T test (I) are shown in the graph or as ****P<0.0001, ***P<0.001, **P<0.01 and *P<0.05.

