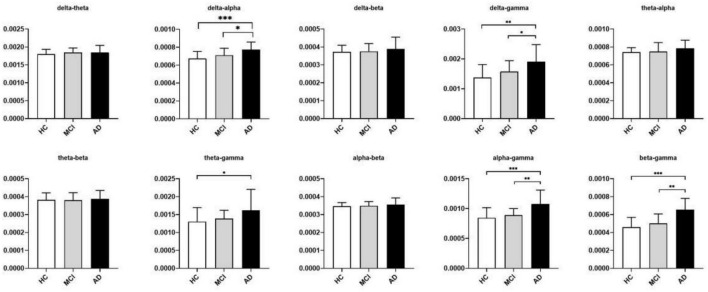
FIGURE 3.
Between-group differences in coupling strength between multiple frequency bands identified using the nonparametric Kruskal-Wallis test with DSCF correction for each class. The histograms show median values and interquartile ranges. The Y-axis represented the global average cross-frequency coupling strength. Relative to the HCs, AD patients showed higher levels of delta-alpha, delta-gamma, theta-gamma, alpha-gamma, and beta-gamma coupling strengths. Relative to the MCI patients, AD patients showed higher levels of delta-alpha, delta-gamma, alpha-gamma, and beta-gamma coupling strengths. *p < 0.05, **p < 0.01, and ***p < 0.001. See Table 2 for more detailed statistical information. HC, healthy controls; MCI, mild cognitive impairment; AD, Alzheimer’s disease.

