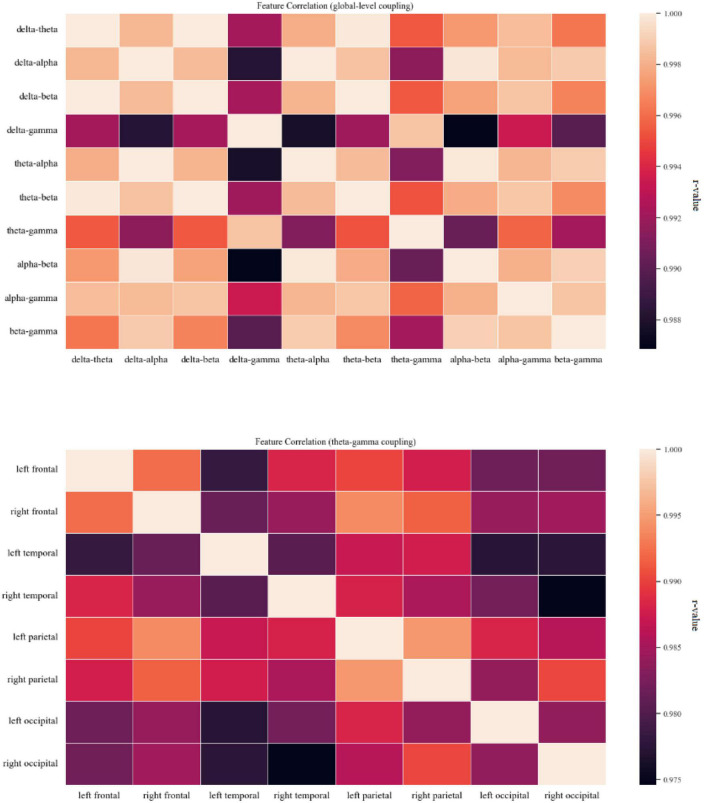
FIGURE 4.
Coupling feature correlation. The panel on the top shows a thermal correlation diagram for global-level coupling, and the panel on the bottom shows a thermal correlation diagram of theta-gamma coupling between brain regions. Lighter colors indicate stronger correlation. High correlations (r ≥ 0.75) between coupling features were found.

