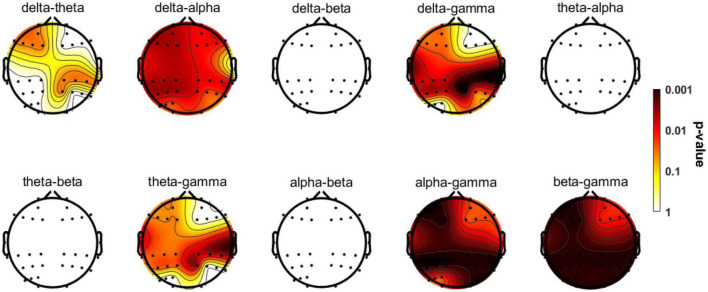
FIGURE 5.
Topographic distributions of statistically significant differences in CFC among the three groups. The values are color coded. Redder color indicates smaller P-value. Statistically significant differences occurred in delta-theta, delta-alpha, and delta/theta/alpha/beta-gamma couplings. See Table 3 for more detailed post hoc statistical information.

