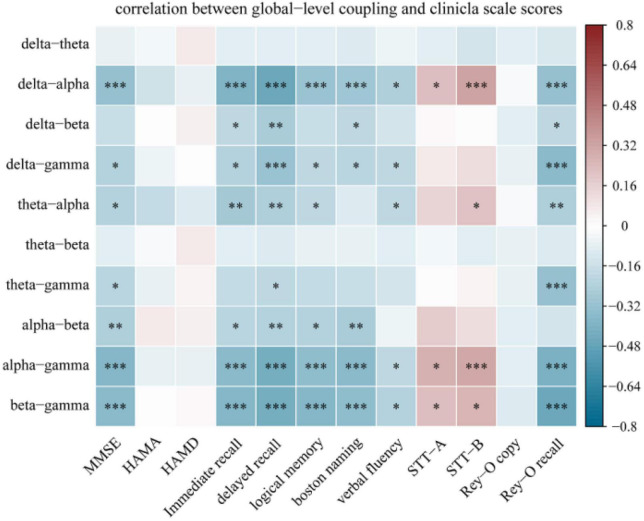
FIGURE 6.
Spearman correlation analysis between global-level coupling and clinical scale scores. The Y-axis represents the global-level coupling. Red indicates a positive correlation, and blue indicates a negative correlation. The darker the color, the larger the correlation coefficient. Correlations between MMSE score and memory function accounted for the largest proportion (26.42%) of significant correlations. *p < 0.05, **p < 0.01, and ***p < 0.001. Memory function was measured using the Hopkins Verbal Learning Test-Revised (HVLT-R), which includes tests of both immediate recall and delayed recall, and the logical memory test (Wechsler memory scale). Language function was assessed using the Boston Naming Test and the Verbal Fluency Test. Executive function was measured using the Shape Trial Test-A and B (STT-A and STT-B). Visual space navigation function was assessed using the Rey-Osterrieth Complex Figure Test (CFT), which includes a copy test and a recall test.

