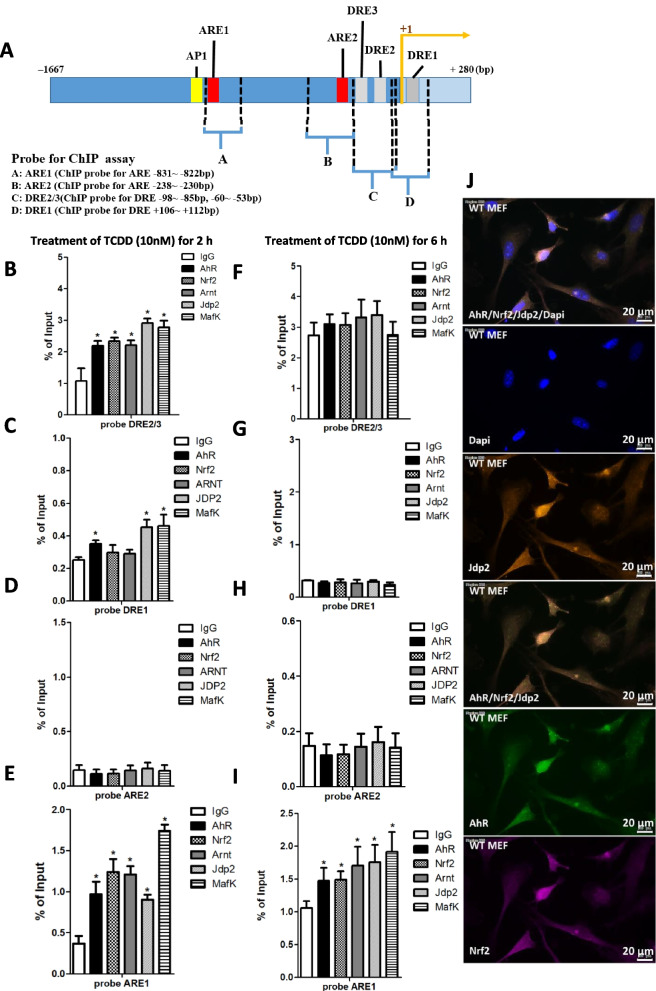
Fig. 3.
Chromatin immunoprecipitation (ChIP) assay and colocalization study of the AhR–Jdp2–Nrf2 axis. A Schematic representation of the mouse AhR promoter and the position of cis-elements, such as ARE1, ARE2, DRE1, and DRE2/3, which were detected using the ChIP assay. B–I Regions amplified by PCR with the specific corresponding primers (ARE1, ARE2, and DRE1) and with the primers that contained the DRE2 and DRE3 cis-elements, as indicated in WT MEFs. ChIP–qPCR analyses were performed using chromatin extracts from WT MEFs stimulated with TCDD for 2 h B–E or 6 h F–I using the antibodies indicated and normal IgG as a negative control. The probes for ARE1 (E, I), ARE2 (D, E), DRE1 (C, G), and DRE2/3 (B, F) are shown in the presence of 10 nM TCDD. Values represent the mean ± SEM (n = 5). Data were analyzed using one-way ANOVA with the Tukey post hoc test (*p < 0.05). J Colocalization of Jdp2, Nrf2, and AhR. WT MEFs were stained with rabbit anti-Jdp2, anti-mouse AhR (Clone A-3; Santa Cruz Biotechnology Inc., Dallas, TX, USA), anti-mouse Nrf2 (Santa Cruz Biotechnology), goat anti-rabbit IgG Alexa Fluor 594 (Themo Fisher Scientific, Walsum, MA, USA), goat anti-mouse IgG Alexa Fluor 488 (Thermo Fisher Scientific), and goat anti-mouse IgG Alexa Fluor 647 (Thermo Fisher Scientific). Scale bars, 30 μm

