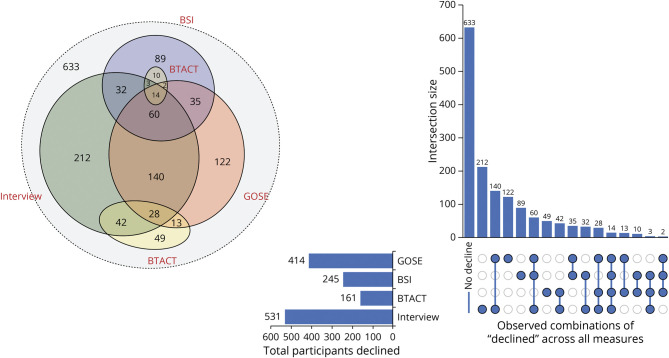
Figure 2. Area-Proportional Venn Diagram and Upset Plot Displaying Areas of Decline Across Potential Combinations in the Mild TBI Group Aggregated Across Postinjury Years 2–7.
BSI = Brief Symptom Inventory; BTACT = Brief Test of Adult Cognition by Telephone; GOSE = Glasgow Outcome Scale–Extended; TBI = traumatic brain injury.

