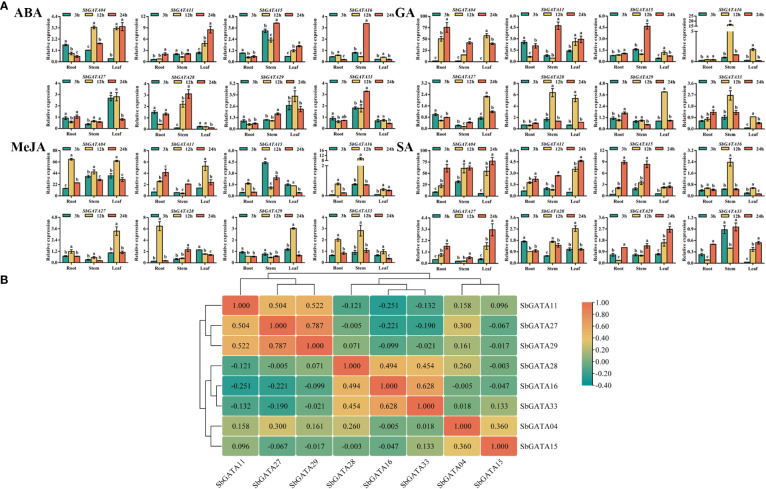
Figure 11.
Relative transcriptional activity and corresponding correlation analysis of eight SbGATAs (SbGATA04, SbGATA11, SbGATA15, SbGATA16, SbGATA27, SbGATA28, SbGATA29 and SbGATA33) under different hormone treatments (abscisic acid, ABA; gibberellin, GA; methyl jasmonate, MeJA; and salicylic acid, SA) at the seedling stage. (A) Relative transcription activity of eight SbGATAs in root, stem, and leaf at 3 h, 12 h, and 24 h after hormone treatment. Values of column chart are expressed as Mean ± SD, the different lowercase letters represent significant differences (p<0.05, Duncan test). (B) Correlation analysis of relative transcriptional activity between different SbGATAs after the treatments. Positive number represents positive correlation and negative number indicates negative correlation. The right color scale (−0.40 to 1.00, green to orange) represents the normalized gene expression correlation.

