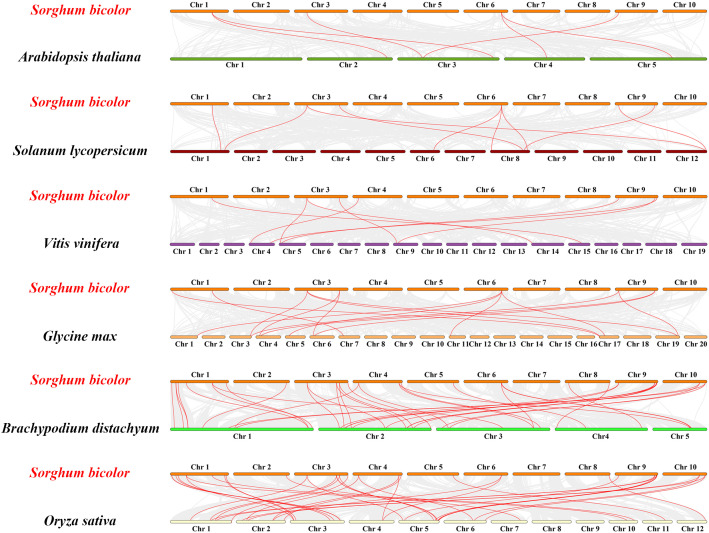
Figure 6.
Synteny analysis of GATA genes between Sorghum bicolor and six other plants (Arabidopsis thaliana, Solanum lycopersicum, Vitis vinifera, Glycine max, Brachypodium distachyon and Oryza sativa). The gray lines between Sorghum bicolor and the other plant represent synteny blocks in the wide genomes of Sorghum bicolor and other plants, while red lines indicate the orthologous relationship of GATA genes.

