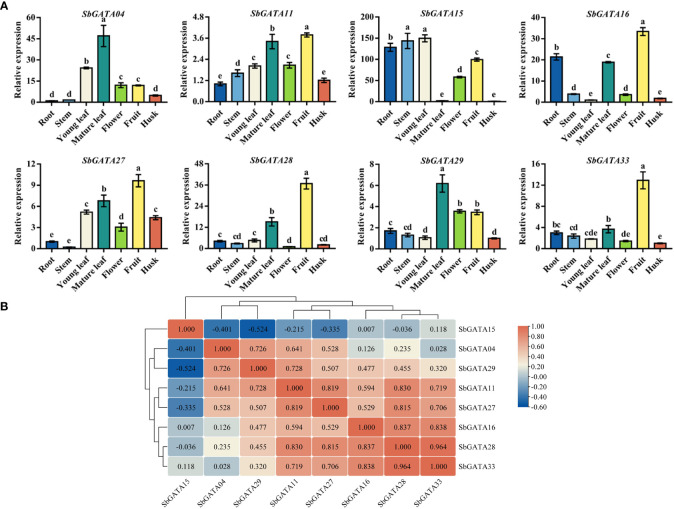
Figure 8.
Relative transcriptional activity and corresponding correlation analysis of eight SbGATAs including SbGATA04, SbGATA11, SbGATA15, SbGATA16, SbGATA27, SbGATA28, SbGATA29 and SbGATA33. (A) Relative transcription activity of eight SbGATAs at the mid-grain filling stage in root, stem, young leaf, mature leaf, flower, fruit, and husk. Values of column chart are expressed as Mean ± SD, the different lowercase letters represent significant differences (p<0.05, Duncan test). (B) Corresponding correlation hierarchical cluster analysis. Positive number represents positive correlation and negative number indicates negative correlation. The right color scale (−0.60 to 1.00, blue to red) represents the normalized gene expression correlation.

