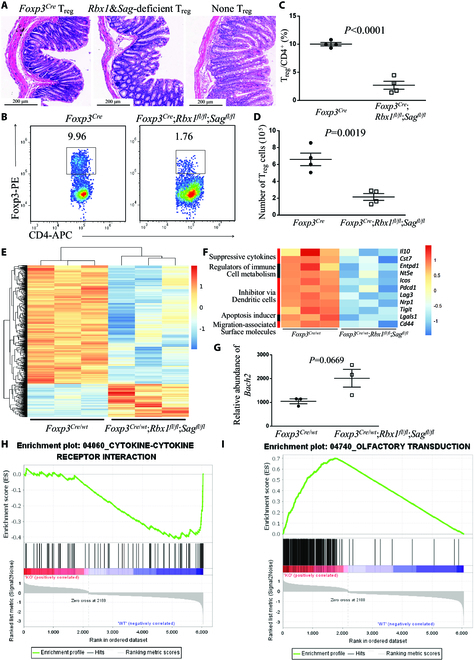
Fig. 5.

Impaired suppressive function of Rbx1&Sag-deficient Treg cells. (A) Representative images of distal colon after H&E staining (scale bar = 200 μm). (B) Expression of Foxp3 in CD4+ T cells in peripheral lymph nodes from Foxp3Cre and Foxp3Cre;Rbx1fl/fl;Sagfl/fl mice at p20. (C) Treg/CD4+ ratios in peripheral lymph nodes from Foxp3Cre and Foxp3Cre;Rbx1fl/fl;Sagfl/fl mice (p19 to p20, n = 4). (D) Treg cell numbers in peripheral lymph nodes from Foxp3Cre and Foxp3Cre;Rbx1fl/fl;Sagfl/fl mice (p19 to p20, n = 4). (E) Unsupervised cluster analysis of the transcriptional alterations in Rbx1&Sag-deficient Treg cells compared to the Foxp3Cre control Treg cells with Fc > 1.5 and P < 0.05. (F) Differentially expressed genes related to Treg cell function in CD4+YFP+ Treg cells from Foxp3Cre/wt and Foxp3Cre/wt;Rbx1fl/fl;Sagfl/fl mice, determined by transcriptional profiling with Fc > 1.5 and P < 0.05. (G) Relative abundance of Bach2 mRNA in CD4+YFP+ Treg cells from Foxp3Cre/wt and Foxp3Cre/wt;Rbx1fl/fl;Sagfl/fl mice, determined by transcriptional profiling. (H) GSEA of cytokine–cytokine receptor interaction genes in CD4+YFP+ Treg cells from Foxp3Cre/wt and Foxp3Cre/wt;Rbx1fl/fl;Sagfl/fl mice, determined by transcriptional profiling with Fc > 1.5 and P < 0.05. (I) GSEA of olfactory transduction genes in CD4+YFP+ Treg cells from Foxp3Cre/wt and Foxp3Cre/wt;Rbx1fl/fl;Sagfl/fl mice, determined by transcriptional profiling with Fc > 1.5 and P < 0.05.
