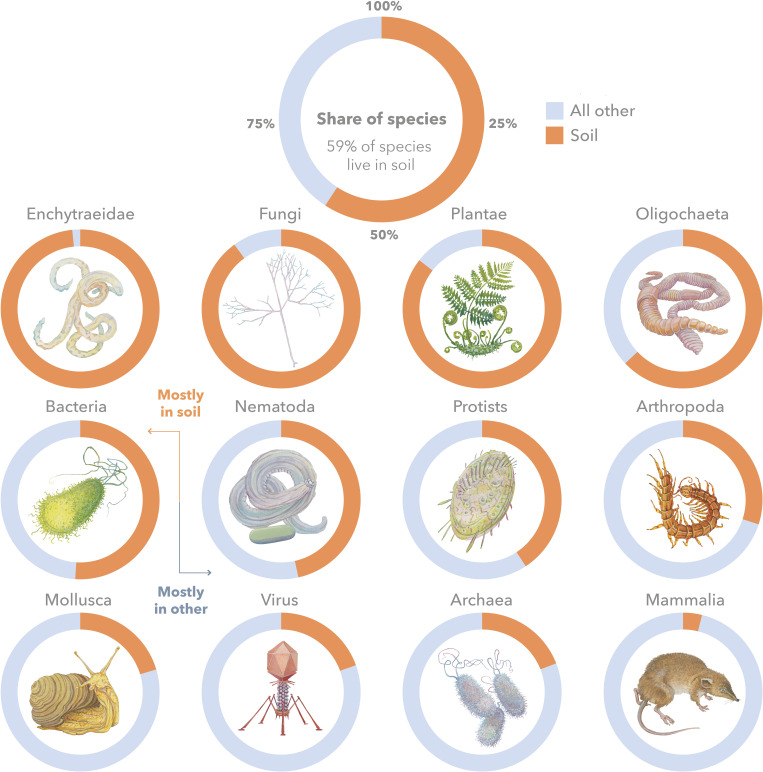
Fig. 3.
Graphical overview of the share of species living in soil. Doughnuts reflect the percentage of species in soil versus all other ecosystems combined (e.g., marine, freshwater, built environment, host organisms such as humans). The larger doughnut on top shows the total share of species, and smaller doughnuts show individual shares for the most speciose and well-known groups ordered from greatest to least specialized in soil. Illustrations by Michael Dandley ©.

