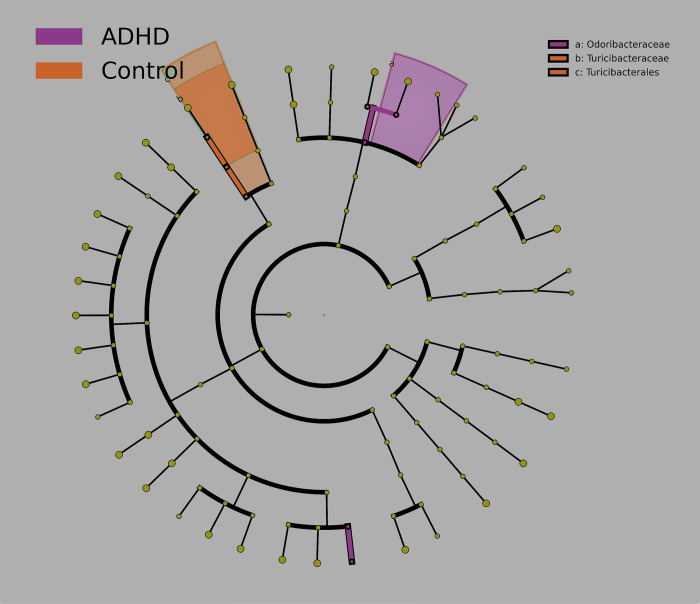
Fig 4. Differential abundance (Cladogram).
Taxa reported by LEfSe as elevated for Control (orange) and ADHD (purple) groups, produced by LEfSe [77] (p ≤ 0.05, Bonferroni correction). LEfSe-reported taxa are plotted on a cladogram, with each concentric circle representing a phylogenetic classification level (innermost = phylum). Shared areas represent distinctive regions of the phylogenetic tree.

