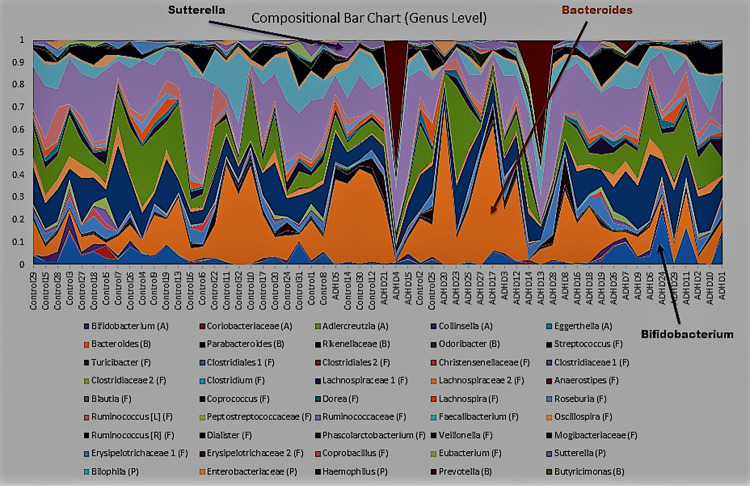
Fig 7. Taxa plots, genus level.
Plots of taxa relative abundance for each subject, generated using Qiime [81], conducted at the genus level. Subjects are ordered by increasing Adult ADHD Self Report Scale (ASRS) score, with the y-axis representing relative abundance.

