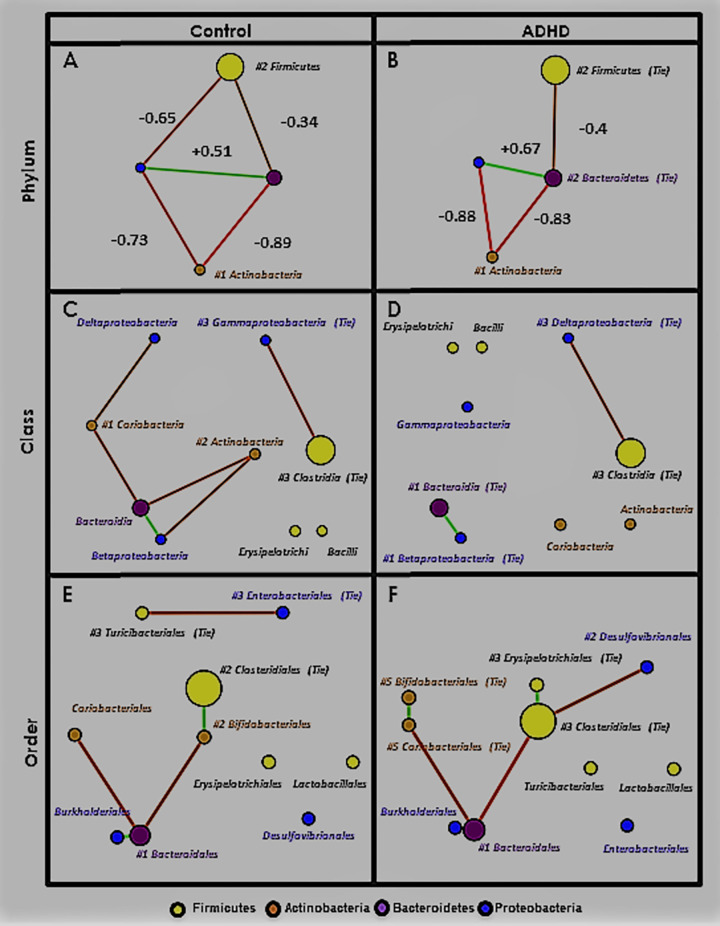
Fig 8. Upper-level Microbial Co-occurrence Networks (MCNs).
MCNs at the phylum (A), class (B), and order (C) taxonomic levels, visualized using Cytoscape [57], and oriented by Fruchterman-Reingold [58]. Nodes represent taxa, colored by phylum (yellow = Firmicutes, purple = Bacteroidetes, brown = Actinobacteria, blue = Proteobacteria) with size directionally proportional to abundance. The co-occurrences are distinguished by those that co-habit (green edges) and co-avoid (red edges). SparCC [112] correlation (p≤0.01) was used as edge weight and also the parameter for Fruchterman-Reingold when determining edge length (larger = closer). SparCC correlations are shown at the phylum level. All taxa found as important by ATria are denoted by a pound sign (#) followed by its rank (ties indicated).

