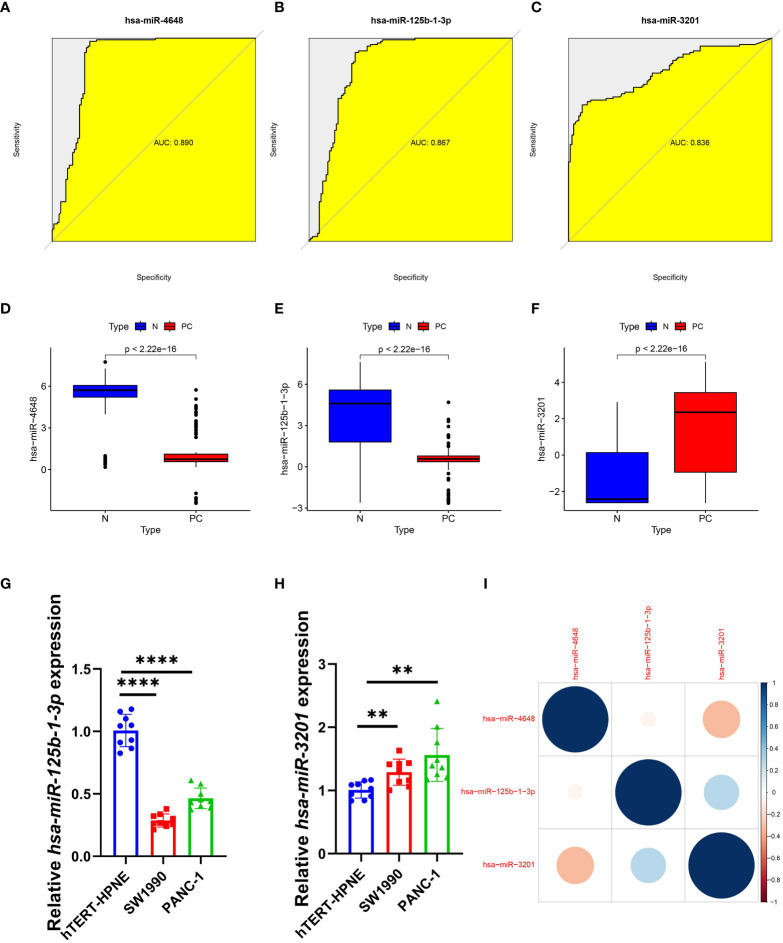
Figure 4.
Diagnostic effect and correlation analysis of PCRSMs. (A–C) ROC curves for three PCRSMs. (D–F) Box plots describing the expression of three PCRSMs in pancreatic cancer and normal control groups. (G, H) Verification of three PCRSMs by qRT-PCR. **P < 0.01, ****P < 0.0001. (I) Correlation analysis between the three PCRSMs by heatmap.

