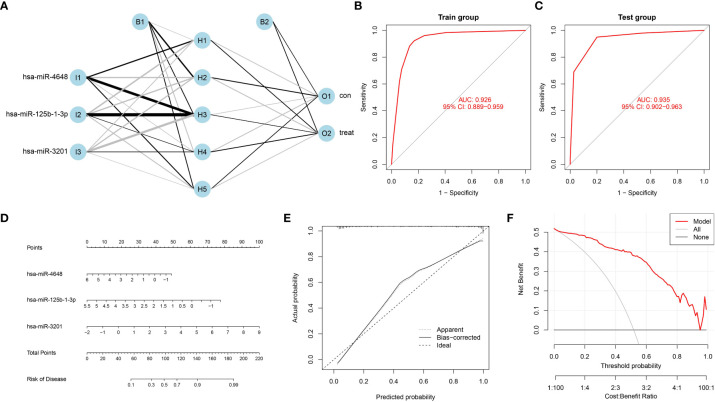
Figure 5.
Construction of an artificial neural network model and a bar plot based on PCRSMs. (A) Artificial neural network (ANN) model for distinguishing between pancreatic cancer and normal control groups, consisting of three input layers, five hidden layers, and two output layers. (B, C) ROC curves of the ANN model diagnostic performance in the training group (GSE85589 and GSE113486 merged) and the validation group (GSE59856). (D) Bar plot integrating PC feature miRNAs. (E) A calibration curve was constructed to assess the predictive accuracy of the bar plot, providing insights into its reliability and performance. (F) Decision curve analysis was conducted to evaluate the clinical utility of the bar plot, demonstrating its potential benefits in guiding clinical decision-making.

